Executive-Pay Tax Break Saved Fortune 500 Corporations $27 Billion Over the Past Three Years

April 23, 2013 11:45 PM | | Bookmark and Share

Read this fact sheet in PDF.

Apple & Facebook Biggest Beneficiaries of Stock Option Loophole

Earlier this year, Citizens for Tax Justice reported that Facebook Inc. had used a single tax break, for executive stock options, to avoid paying even a dime of federal and state income taxes in 2012. Since then, CTJ has investigated the extent to which other large companies are using the same tax break. This short report presents data for 280 Fortune 500 corporations that, like Facebook, disclose a portion of the tax benefits they receive from this tax break.

  • These 280 corporations reduced their federal and state corporate income taxes by a total of $27.3 billion over the last three years, by using the so-called “excess stock option” tax break.
  • In 2012 alone, the tax break cut Fortune 500 income taxes by $11.2 billion.
  • Just 25 companies received more than half of the total excess stock option tax benefits accruing to Fortune 500 corporations over the past three years.
  • Apple alone received 12 percent of the total excess stock option tax benefits during this period, enjoying $3.2 billion in stock option tax breaks during the past three years. JP Morgan, Goldman Sachs and ExxonMobil collectively enjoyed 10 percent of the total.
  • In 2012, Facebook wiped out its entire U.S. income tax liability by using excess stock option tax breaks.
  • Over the past three years, Apple slashed its federal and state income taxes by 20 percent using this single tax break.

How It Works: Companies Deduct Executive Compensation Costs They Never Actually Paid

Most big corporations give their executives (and sometimes other employees) options to buy the company’s stock at a favorable price in the future. When those options are exercised, corporations can take a tax deduction for the difference between what the employees pay for the stock and what it’s worth (while employees report this difference as taxable wages).

Before 2006, companies could deduct the “cost” of the stock options on their tax returns, reducing their taxable profits as reported to the IRS, but didn’t have to reduce the profits they reported to their shareholders in the same way, creating a big gap between “book” and “tax” income. Some observers, including CTJ, argued that the most sensible way to resolve this would be to deny companies any tax deduction for an alleged “cost” that doesn’t require an actual cash outlay, and to require the same treatment for shareholder reporting purposes.

But instead, rules in place since 2006 maintained the tax write-off, but now require companies to lower their “book” profits somewhat to take account of options. But the book write-offs are still usually considerably less than what the companies take as tax deductions. That’s because the oddly-designed rules require the value of the stock options for book purposes to be calculated — or guessed at — when the options are issued, while the tax deductions reflect the actual value when the options are exercised. Because companies typically low-ball the estimated values, they usually end up with much bigger tax write-offs than the amounts they deduct in computing the profits they report to shareholders.

Reforming the Excess Stock Option Tax Break

Despite the changes that took effect in 2006, the stock option tax break is still clearly reducing the effectiveness of the corporate income tax. A November 2011 CTJ report assessing the taxes paid by the Fortune 500 corporations that were consistently profitable from 2008 through 2010 identified the excess stock option tax break as a major factor explaining the low effective tax rates paid by many of the biggest Fortune 500 companies.1

In recent years, some members of Congress have taken aim at this tax break. In February of 2013, Senator Carl Levin (D-MI) introduced the “Cut Unjustified Loopholes Act,” which includes a provision requiring companies to treat stock options the same for both book and tax purposes, as well as making stock option compensation subject to the $1 million cap on corporate tax deductions for top executives’ pay.

The PDF version of this report includes the full list of 280 corporations and the size of their reported federal and state tax break for excess stock options in the three year period between 2010 and 2012.


1 Citizens for Tax Justice, Corporate Taxpayers & Corporate Tax Dodgers, 2008-2010, November 3, 2011, page 10. http://ctj.org/corporatetaxdodgers/


    Want even more CTJ? Check us out on Twitter, Facebook, RSS, and Youtube!

Bernie Sanders Is Right and the Tax Foundation Is Wrong: The U.S. Has Very Low Corporate Income Taxes

April 23, 2013 02:19 PM | | Bookmark and Share

Read this report in PDF.

Senator Bernie Sanders of Vermont recently appeared on Real Time with Bill Maher and disputed the claim by the Tax Foundation that the U.S. has the highest corporate tax in the world.

During a debate over spending and revenues, Senator Sanders said it’s time to ask the “one out of four corporations not paying any taxes” to contribute. The Wall Street Journal’s Stephen Moore replied with the standard complaint, “We have the highest corporate tax rate in the world. … Thirty-five percent. The Tax Foundation says the United States of America has the highest corporate tax rate.”  Sanders replied that this is the “nominal, not effective” corporate tax rate.[1] The Tax Foundation then issued a written response claiming that even the effective corporate tax rate in the U.S. is very high compared to those of other countries. [2]

Senator Sanders is right, the Tax Foundation is wrong.

Effective Tax Rates vs. Nominal or Statutory Tax Rates

The U.S. statutory tax rate of 35 percent is almost entirely irrelevant. The effective corporate tax rate (what corporations actually pay as a percentage of their profits) is what matters, and it’s far lower than the statutory corporate tax rate because of the loopholes that allow corporations to avoid taxes. The U.S. effective corporate tax rate is also far lower than the Tax Foundation claimed in a written response to Senator Sanders.

While the statutory corporate income tax rate for the U.S. may be high compared to those of other countries, the total federal corporate income tax collected in the U.S. in 2010 was equal to just 1.3 percent of our gross domestic product  — in other words, 1.3 percent of our total economic output — according to the Treasury Department. The figure is 1.6 percent of GDP when state corporate income taxes are included.[3]

Data from the Organizations for Economic Cooperation and Development (OECD) show that the OECD countries other than the U.S. collected corporate tax revenue equal to 2.8 percent of their combined GDPs in 2010. This is another way of saying that the weighted average of corporate tax collected as a percentage of GDP for the countries that are the U.S.’s main trading partners and competitors was 2.8 percent in 2010. (2010 is the most recent year for which the OECD has complete data.)[4]

Some critics of corporate taxes claim that the declining share of the GDP paid in corporate income taxes collected in the U.S. reflects in part the growth in “pass-through” entities which are taxed only under the personal income tax and not under the corporate income tax. But almost all of the corporate income tax is paid by giant corporations, hardly any of which have shifted to pass-through status.[5]

In addition, effective corporate tax rates (on non-pass-through corporations) are very low in the United States, as CTJ has demonstrated in its comprehensive corporate tax reports.

One of the most cited of those reports was released in November of 2011 and examined most of the Fortune 500 companies that had been profitable each year over the 2008-10 period. Collectively, the companies studied paid just 18.5 percent of their profits in U.S. corporate income taxes over the three years that were studied — only half the 35 percent official corporate tax rate. Thirty of the companies paid less than nothing and had negative corporate income tax rates over that period.[6]

We are currently working on an update to this study, and recently released data showing ten examples of companies that paid negative or extremely low effective tax rates in 2012 and over the past five years.[7]

The Tax Foundation Relies on Flawed Research

In its written response to Senator Sanders, the Tax Foundation claims that

Even when including all deductions and credits available to companies to lower their tax liabilities, the “effective” tax rate of U.S. corporations is still among the very highest in the world. The most recent studies show a U.S. effective corporate tax rate of roughly 27 percent, compared to an average of 20 percent for other developed countries.

To back this assertion, the Tax Foundation cites its 2011 report that reviewed nine different studies of effective tax rates.[8] On close inspection of these studies, it turns out that six of them do not even examine the taxes and profits of actual firms but rather are based on models of taxation applied to hypothetical firms.

Only three of these studies are based on what the authors considered to be the actual taxes and profits paid by firms according to their financial reports. But these studies have several severe methodological problems that made it almost impossible for them to come to any conclusion other than that U.S. corporate taxes are high.

For example, one of the studies, by Kevin S. Markle and Douglas A. Shackelford of the National Bureau of Economic Research, actually states (on page 10) that it excludes those companies with a negative effective tax rate.[9] This essentially means that the study simply excludes those companies that are corporate tax dodgers, which obviously will result in a higher estimate for the average effective tax rate.

To take another example, a study by PricewaterhouseCoopers and the Business Roundtable counts what companies report in their financial filings as “deferred” taxes, as well as “current taxes” as taxes paid by a company.[10] As we have explained before, current taxes are the taxes a company actually pays during the year, while deferred taxes are the taxes that the company might pay at some point in the future (and if they ever are paid they will show up as current taxes in the financial report for that year).[11] In other words, “deferred” taxes are taxes that companies have not paid (and may never pay) and should not be counted as taxes paid.

Determining Actual Effective Corporate Tax Rates

Ultimately, the only way to understand how much corporations are actually paying in taxes is to do the painstaking work that CTJ does in going through the financial reports filed by corporations, and uncovering the hidden tax breaks that go unnoticed in the large, error-prone databases that these other studies tend to rely on.

For example, a simple reading of Facebook’s 2012 10-K annual financial report might suggest that the company pays a very large amount of federal income tax: the income tax note for the 2012 report says the company paid a current federal income tax of $559 million on its $1.062 billion in pretax US income. This implies an effective federal tax rate of 52.6%, which is a lot.

But in fact, the company reduced its federal income taxes by more than $1 billion in 2012 through the “excess stock option” tax break, the effects of which are not reported in the income tax note. Researchers using databases that simply report the contents of the income tax note will miss this essential piece of information.

The truth is that, by any measure, U.S. corporate income taxes are very low. And as a share of the economy, they are much lower than are corporate income taxes in almost every other developed country.


[1] Bud Meyers, “Bill Maher, Bernie Sanders, Makes Fool of Stephen Moore,” Daily Kos, April 12, 2013. http://www.dailykos.com/story/2013/04/12/1201358/-Bill-Maher-Bernie-Sanders-Makes-Fool-of-Stephen-Moore

[2] Richard Morrison, “Yes, Sen. Sanders, We Really Do Have the Highest Corporate Tax Rate in the World,” Tax Foundation, April 12, 2013. http://taxfoundation.org/article/yes-sen-sanders-we-really-do-have-highest-corporate-tax-rate-world

[3] In calendar 2010, the U.S. federal government collected $193.4 billion in corporate income taxes. (Monthly Treasury Statements for January 2010 to December 2010, http://www.fms.treas.gov/mts/backissues.html.)  In addition, state and local governments in the U.S. collected $42.9  billion in corporate income taxes in 2010 (U.S. Census Bureau, http://www2.census.gov/govs/estimate/summary_report.pdf. Table A-1 (page 6). So total federal, state and local corporate income taxes in the U.S. in 2010 were $236.3 billion. This is 1.6 percent of U.S. GDP in 2010, which was $14.5 trillion.

[4] OECD data is available at http://stats.oecd.org/ The OECD routinely far overestimates U.S. corporate taxes as a percentage of GDP, and we have corrected OECD’s error. For some reason, the OECD gets its U.S. corporate tax information from U.S. Bureau of Economic Analysis (BEA), which includes profits of the Federal Reserve as “corporate taxes.” Historically, this has caused OECD to overstate U.S. corporate income taxes by about 10 percent. But Federal Reserve profits have ballooned in recent years, causing OECD to overstate U.S. corporate income taxes by 23 percent in 2009 and 32 percent in 2010.  In addition, the OECD initially publishes preliminary data from the BEA, which includes corporate taxes paid by U.S. corporations to foreign governments (an error which OECD later corrects when BEA releases final data). Because of these two errors, OECD currently overstates U.S. federal, state and local corporate by almost two-thirds in 2010.

[5] The U.S. corporate income tax has always been paid by a relatively small number of companies that has not changed very much over time. IRS data show that in 1995, 6,258 companies (which had assets of at least $250 million that year) paid 78 percent of the corporate income tax collected during that year. In 2008, a similar number of companies, 6,584 companies (which had assets of at least $500 million that year) paid 82 percent of the corporate income tax collected during that year.

[6] Citizens for Tax Justice, “Corporate Taxpayers and Corporate Tax Dodgers: 2008-2010,” November 3, 2011. http://ctj.org/corporatetaxdodgers/

[7] Citizens for Tax Justice, “Ten (of Many) Reasons Why We Need Corporate Tax Reform,” April 10, 2013. http://ctj.org/ctjreports/2013/04/ten_of_many_reasons_why_we_need_corporate_tax_reform.php

[8] Philip Dittmer, “U.S. Corporations Suffer High Effective Tax Rates by International Standards,” Tax Foundation, September 2011. http://taxfoundation.org/sites/taxfoundation.org/files/docs/sr195.pdf

[9] Kevin S. Markle and Douglas A. Shackelford, “Cross-Country Comparisons of Corporate Income Taxes,” National Bureau of Economic Research Working Paper No. 16839, February 2011, http://www.nber.org/papers/w16839.pdf.

[10] “Global Effective Tax Rates,” PricewaterhouseCoopers and Business Roundtable, April 14, 2011, http://businessroundtable.org/studies-and-reports/global-effective-tax-rates/.

[11] Citizens for Tax Justice, “GE Tries to Change the Subject,” February 29, 2012. http://ctj.org/ctjreports/2012/02/ge_tries_to_change_the_subject.php


    Want even more CTJ? Check us out on Twitter, Facebook, RSS, and Youtube!

Six Things You Need to Know on Tax Day

April 15, 2013 10:09 AM | | Bookmark and Share

Read the Single Page PDF.

1. Virtually all Americans, including the poorest Americans, pay taxes.

■ When someone says almost half of Americans are not paying taxes, that refers to just one tax, the federal personal income tax, and ignores the many other taxes Americans at all income levels pay.

■ Overall, state and local taxes actually take a larger share of income from a poor family than they take from a higher-income family.

2. America is NOT overtaxed.

■ Of the world’s developed countries, only two (Chile and Mexico) collect less tax revenue as a share of their economy than does the U.S.

■ The countries collecting more in taxes, as a share of their economy, than the U.S. include our trade partners and competitors, like France, Germany, the United Kingdom, Canada, South Korea and others.

3. Wealthy Americans are NOT overtaxed.

■ When you add up all the different federal, state and local taxes that Americans pay, you find that our overall tax system is just barely progressive.

■ The richest one percent of Americans pay 24.0 percent of the total taxes in America, but they also take in 21.9 percent of the total income in America.

4. U.S. corporations are Undertaxed.

■ CTJ’s study of 280 profitable Fortune 500 corporations found that they on average only paid about half the official corporate tax rate of 35 percent during 2008 through 2010.

■ Many large profitable companies, including Facebook, Pepco, Southwest Airlines and others, paid nothing in corporate income taxes during 2012.

5. Tax cuts for the rich do not help our economy.

■ Using data from the past 65 years, the Congressional Research Service has found that there is no correlation between top tax rates and economic growth.
■ This conclusion holds true at the state level, where research from ITEP and academic economists has shown lowering or eliminating state income taxes to have little if any impact on state economies.

6. Your Tax Bracket is Not Your Effective Tax Rate

■ If your income grows and you find yourself “in” a higher tax bracket, your tax rate does not go up on all of your income, it only goes on the portion of you income above the specific income threshold. 

■ Over 99.9% (PDF) of taxpayers pay an effective federal income tax rate of less than 30 percent, well below the top marginal tax rate.


    Want even more CTJ? Check us out on Twitter, Facebook, RSS, and Youtube!

President Obama’s Tax Proposals in his Fiscal 2014 Budget Plan

April 11, 2013 03:55 PM | | Bookmark and Share

Read this fact sheet in PDF.

President Obama has proposed some very modest changes in federal taxes in his Fiscal 2014 budget plan. Over the upcoming decade, the President’s proposal would boost total federal revenues by only $851 billion. That’s less than a 3 percent increase.

Here are the percentage changes in federal taxes that Obama proposes over the upcoming decade by type of tax:

■    Personal income taxes, mostly on the wealthy, would go up by 4 percent.

■    Corporate taxes would increase by 1 percent.

■    Excise taxes would increase by 10 percent.

■    Estate and gift taxes would go up by 40 percent.

In total, federal revenues would increase by 2.8 percent over 10 years.

Except for the excise tax increases (mainly almost a $1 per pack tax hike on cigarettes), most of the President’s proposed net tax increases would fall on the very well off.

Because his tax proposals are so modest, the President found it necessary to propose major reductions in domestic programs in order to reduce future budget deficits. Overall, his budget predicts that domestic appropriations will fall by almost a third as a share of the GDP by fiscal 2023. That sharply reduced level would also be a third less as a share of the GDP than under President Ronald Reagan.

In the text of his budget, the President also says he favors “revenue-neutral” “corporate tax reform that will close loopholes [and] lower the corporate tax rate.” Toward that end, he lists 57 specific changes that he would make to limit or expand corporate loopholes in the context of reform (these items are not included in his budget plan). Enacting all of these proposals would raise an average of less than $10 billion a year. That would allow about a half a percentage point reduction in the corporate tax rate from the current 35 percent to about 34.5 percent.

A summary list of the tax changes proposed by the President and their estimated revenue effects can be found below:

Tax Changes Proposed in President Obama’s Fiscal 2014 Budget

10-Year Totals, Fiscal 2014-23; $-billions

Individual income tax increases:

Limit the benefits of itemized deductions and certain other deductions and exclusions to 28% of the amount deducted or excluded

 $ +529

Reduce the inflation adjustment for tax brackets and other tax items (“chained CPI”)

+100

Implement the “Buffett Rule” (30% minimum tax on the wealthy)

+53

Tax investment managers at regular tax rates on their management fees (“carried interest”

+16

Limit the total amount that can be accumulated in IRAs and other retirement funds to $3 million

+9

Other individual income tax increases

+7

Subtotal, individual income tax increases

 $ 715

Individual income tax reductions:

Make the recently extended expansion of the EITC and child credit permanent

 $ –161

Expansion of retirement savings tax breaks for low- and moderate-income taxpayers

–18

Tax “simplification”

–9

Expand the dependent care tax credit

–9

Other individual income tax reductions

–3

Subtotal, individual income tax reductions

 $ –199

Net individual income tax changes ………………………………………………………………

 $ +516

Other tax increases:


Restore the 2009 estate & gift tax rules, plus other small estate tax reforms

 $ +79

Increase the cigarette tax by 94 cents per pack

+78

Reduce the tax gap (reduce cheating by individuals and businesses)

+78

Increase the unemployment tax

+67

Impose a fee on large banks

+59

Restore Superfund environmental clean-up tax on polluters

+20

Miscellaneous

+4

Subtotal, other tax increases

 $ +385

Other tax cuts:

Tax breaks for public infrastructure investments

 $ –17

Various business tax cuts

–33

Subtotal, other tax cuts

 $ –50

Net other tax increases and tax cuts ……………………………………………………………..

 $ +334

Total Net Proposed Tax Changes ……………………………………………………………..

 $ +851

Note: Tax changes include proposed changes in refundable tax credits.


    Want even more CTJ? Check us out on Twitter, Facebook, RSS, and Youtube!

Ten (of Many) Reasons Why We Need Corporate Tax Reform

April 10, 2013 04:58 PM | | Bookmark and Share

Read this fact sheet in PDF.

Companies From Various Sectors Use Legal Tax Dodges to Avoid Taxes

This CTJ report illustrates how profitable Fortune 500 companies in a range of sectors of the U.S. economy have been remarkably successful in manipulating the tax system to avoid paying even a dime of tax on billions of dollars in profits. These ten corporations’ tax situations shed light on the widespread nature of corporate tax avoidance.  As a group, the ten companies paid no federal income tax on $16 billion in profits in 2012, and they paid zero federal income tax on $57 billion in profits over the past five years. All but one paid less than zero federal income tax in 2012; all paid exceedingly low rates over five years.

Companies Represent Diverse Economic Sectors

The companies profiled here represent a range of segments of the U.S. economy. While General Electric, Facebook, FedEx and Pepco are fairly well-publicized tax avoiders, this report also includes:

  • The oil and gas exploration company Apache, which paid no tax on $7.6 billion in pretax income over five years, enjoying a $169 million tax rebate over that period.
  • Health-care giant Tenet Healthcare, which hasn’t paid a dime of federal income tax on $905 million in U.S. income over the past five years, receiving a tax rebate of $51 million.
  • In the airline sector, Southwest Airlines paid no federal income taxes on $673 million in U.S. income last year, and actually received an income tax rebate of $45 million.
  • The Principal Financial Group, an investment services provider, which avoided all federal income taxes on its $919 million in 2012.
  • Ryder System, which provided truck rentals and services, paid a negative 2.3 percent federal income tax rate in 2012 and a negative 4.7 percent rate since 2008.
  • The Interpublic Group, a marketing and communications firm, also had negative tax rates both in 2012 and over the five-year period.

All ten companies’ effective federal income tax rates for 2012 and 2008-12 are shown in the following table. (Click on table for high quality version)

Companies’ Low Taxes Stem from a Variety of Legal Tax Breaks

While much recent attention has focused on multinational corporations that have used offshore tax havens to minimize their tax liability, the companies profiled here appear to be using a diverse array of other tax breaks to zero out their federal income taxes:[1]

Southwest Airlines, Ryder and FedEx used accelerated depreciation, a tax break allowing companies to write off the cost of their capital investments much faster than these investments wear out, to dramatically reduce their tax rates. CTJ has estimated that closing the accelerated depreciation loophole could raise over $500 billion over the next five years. Both Congress and President Barack Obama, however, have supported expanding the scope of this tax break in recent years.

Facebook relied on a single tax break — the ability to write off the value of executive stock options for tax purposes — to zero out its tax liability in 2012. Facebook admits that this tax break will offset much of its future taxes as well. U.S. Senator Carl Levin (D-MI) has estimated that this tax break costs between $12 billion and $61 billion a year.

General Electric uses the “active financing” tax break as one of many ways that it eliminates its U.S. income tax bill.[2] This arcane tax break allows some multinational financial institutions to avoid paying income taxes to any government on their international financing activities. The Joint Committee on Taxation estimates the current two-year cost of this provision to be $11.2 billion.

Corporate Tax Reform Should Repeal Tax Loopholes and
Restore Overall Corporate Tax Revenues to a More Reasonable Level

In recent years, the public’s attention has been drawn to the elaborate tax avoidance mechanisms used by a few huge corporations such as General Electric, Apple, Microsoft and others. But as this report indicates, the scope of corporate tax avoidance goes well beyond these few companies, and spans a wide variety of economic sectors. Moreover, the tax breaks that have allowed these companies to be so successful in their tax avoidance are, by and large, perfectly legal, and often have been on the books for decades.

As Congress focuses on strategies for revamping the U.S. corporate income tax, a sensible starting point should be to critically assess the costs of each of these tax breaks, and to take steps to ensure that profitable corporations pay their fair share of the U.S. taxes.

The next step is as, if not more, important. The revenues raised from eliminating corporate tax subsidies should not be given right back to corporations in the form of tax-rate reductions, as corporate lobbyists and their allies inside the Washington Beltway preposterously argue. Instead, as the vast majority of Americans understand, these desperately needed revenues should be used to address our nation’s fiscal problems and to make critically needed public investments in our nation’s future.


[1] Accelerated depreciation and the stock options loophole, and how Congress could raise revenue by repealing them, are described in  Citizens for Tax Justice, “Policy Options to Raise Revenue,” March 8, 2012. http://ctj.org/ctjreports/2012/03/policy_options_to_raise_revenue.php The “active financing exception” is described in Citizens for Tax Justice, “Don’t Renew the Offshore Tax Loopholes,” August 2, 2012. http://ctj.org/ctjreports/2012/08/dont_renew_the_offshore_tax_loopholes.php

[2] As the New York Times documented, the director of GE’s tax department literally “dropped to his knee” when begging House Ways and Means Committee staff to extend the active financing tax break when it was set to expire in 2008. http://www.nytimes.com/2011/03/25/business/economy/25tax.html


    Want even more CTJ? Check us out on Twitter, Facebook, RSS, and Youtube!

The U.S. Continues to Be One of the Least Taxed of the Developed Countries

April 8, 2013 11:26 AM | | Bookmark and Share

Read this fact sheet in PDF.

The U.S. was the third least taxed country in the Organization for Economic Cooperation and Development (OECD) in 2010, the most recent year for which OECD has complete data.

Of all the OECD countries, which are essentially the countries the U.S. trades with and competes with, only Chile and Mexico collect less taxes as a percentage of their overall economy (as a percentage of gross domestic product, or GDP).

This sharply contradicts the widely held view among many members of Congress that taxes are already high enough in the U.S. and that any efforts to reduce the federal deficit should therefore take the form of cuts in government spending.

As the graph to the right illustrates, in 2010, the total (federal, state and local) tax revenue collected in the U.S. was equal to 24.8 percent of the U.S.’s GDP.

The total taxes collected by other OECD countries that year was equal to 33.4 percent of combined GDP of those countries. 

As the table below illustrates, the U.S. has steadily moved closer and closer to becoming the least taxed OECD country over the past three decades.

In 1979, the U.S. had the 16th highest taxes as a percentage of GDP, out of 24 countries at that time.

In 2010, the U.S. had the 32nd highest taxes as a percentage of GDP, out of 34 OECD countries.

Taxes collected by other OECD countries as a percentage of GDP have been above 31 percent throughout this period of years, and in some years have exceeded 34 percent.

In the U.S., taxes as a percentage of GDP never even exceeded 29 percent during this period, except for three years (1998 through 2000). After that, taxes were reduced by the Bush-era tax cuts and other changes, most of which were made permanent in the legislation approved by Congress on New Year’s Day to address the “fiscal cliff.”[i]


[i] For more information about the effects of the “fiscal cliff” deal, see Citizens for Tax Justice, “New Tax Laws in Effect in 2013 Have Modest Progressive Impact,” April 2, 2013.


    Want even more CTJ? Check us out on Twitter, Facebook, RSS, and Youtube!

Who Pays Taxes in America in 2013?

April 1, 2013 06:08 PM | | Bookmark and Share

Read this fact sheet in PDF.

(For more details, see the accompanying report.)

Click on Charts to See High Quality Version.

It is sometimes claimed that many low- and middle-income Americans don’t pay taxes while the richest Americans pay a hugely disproportionate share of taxes, especially after enactment of the “fiscal cliff” deal that allowed some taxes to go up.

As the table to the right illustrates, America’s tax system is just barely progressive even after the fiscal cliff deal’s effects. Claims that the rich pay a disproportionate share of taxes often focus only on the federal personal income tax and ignore the other taxes that people pay, like federal payroll taxes, federal excise taxes, and state and local taxes. Many of these other taxes are regres­sive, meaning they take a larger share of income from poor and middle-income families than they take from  the rich.

The table shows the share of total taxes (all federal, state and local taxes) that will be paid by Americans in different income groups in tax year 2013.

■ Each income group will pay a share of total taxes that is very similar to the share of total income received by that group.

■ The richest one percent of Americans will pay 24 percent of total taxes and receive 21.9 percent of total income.

■ The poorest fifth of Americans will pay 2.1 percent of total taxes and receive 3.3 percent of total income.

■ The effective total tax rate for the richest one percent of Americans will be 33 percent, compared to 26.6 percent for the middle fifth of Americans.

Everyone in America pays taxes. Everyone who works pays federal payroll taxes. Everyone who buys gasoline pays federal and state gas taxes. People who shop in stores pay the sales taxes that most state and local governments impose. State and local property taxes affect everyone who owns or rents a home. (Even renters pay property taxes because landlords pass some of the tax on to them in the form of higher rents). Most states also have income taxes, most of which are not particularly progressive.

Progressivity Needed to Offset Regressive Taxes

To offset the regressive impact of these taxes, we need taxes that are more progressive. Some federal taxes have features that accomplish this, at least to a degree. For example, the federal personal income tax provides refundable tax credits like the Earned Income Tax Credit and the Child Tax Credit, which can reduce or eliminate personal income tax liability for working families and even result in negative personal income tax liability, meaning families receive a check from the IRS.

These tax credits are only available to taxpayers who work, and who therefore pay federal payroll taxes, not to mention the other taxes that disproportionately affect low- and middle-income Americans.

In other words, the parts of the federal personal income tax that may seem like boons to the poor are justified not only by kindness, but also because they offset some of the other taxes that poor and middle-income families must pay.

Recent Tax Changes Have Only Modest Progressive Impact

Tax changes that took effect in 2013, allowing parts of the Bush-era cuts in the federal personal income tax to expire and an increase in the Medicare Hospital Insurance (HI) tax, did make the rich pay higher taxes than they had in earlier years. But the fiscal cliff deal also did not extend a temporary payroll tax break, which had particularly helped low- and middle-income working people in 2011 and 2012.

To see how the distribution of taxes would have been different if Congress had extended all the tax laws in effect in 2012, see the accompanying report: www.ctj.org/pdf/taxday2013report.pdf


    Want even more CTJ? Check us out on Twitter, Facebook, RSS, and Youtube!

New Tax Laws in Effect in 2013 Have Modest Progressive Impact

April 1, 2013 05:57 PM | | Bookmark and Share

Read this report in PDF.

(See the accompanying two-sided fact sheet)

Click on Charts to See High Quality Version.

The deal approved by Congress on New Years Day to address the “fiscal cliff” does not require the richest Americans to pay a disproportionate share of taxes, despite common claims that it does. As the graph and table below illustrate, the deal resulted in a tax system that is modestly more progressive than the one we would have if Congress had simply extended all of the tax laws in effect in 2012.

Taxes have gone up slightly for all income groups because of the expiration of the payroll tax holiday (which was quietly accepted by most lawmakers of both political parties), as well as the expiration of some Bush-era tax cuts for the rich and a previously enacted health-care-related tax on the rich that took effect this year.

The graph and table that follow compare the taxes that Americans in different income groups will or would pay in 2013 under two scenarios. The first reflects the laws now in effect. The second is what Americans would be paying if all of the Bush-era tax cuts had been extended, the 2012 payroll tax cut had also been extended, and the increase in the Medicare Hospital Insurance (HI) on high-income people had not gone into effect.

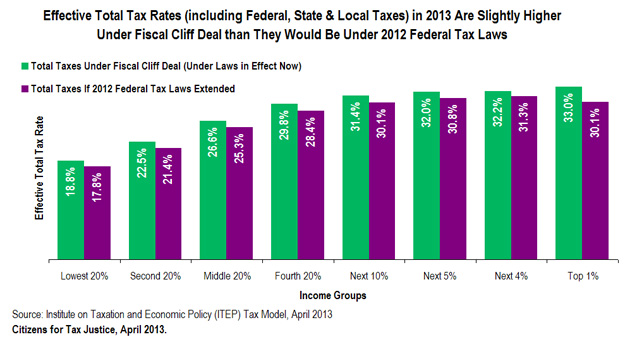
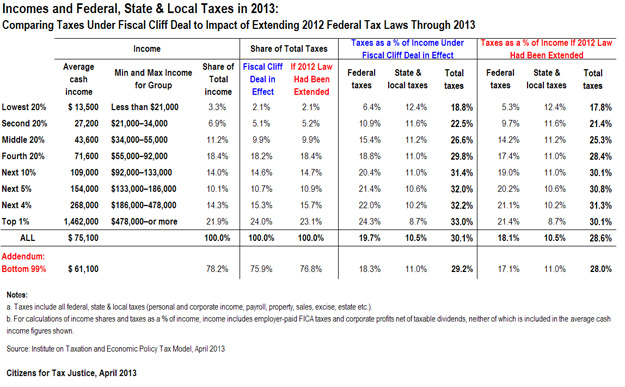
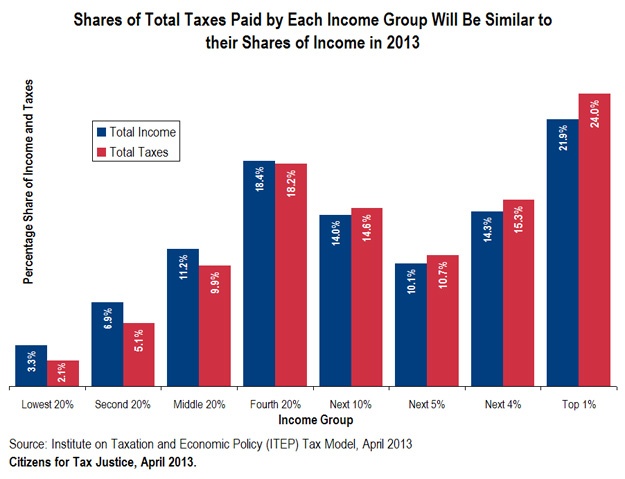
As the table above illustrates, the richest one percent of Americans will receive 21.9 percent of the total income in the U.S. in 2013. Under the tax rules in effect this year, they will pay 24 percent of the total federal, state and local taxes. If Congress had extended all of the tax rules that had been in effect in 2012, then the richest one percent of Americans would pay 23.1 percent of the total taxes this year. In either scenario, the share of taxes paid by the richest one percent is slightly (but not dramatically) larger than the share of total income received by this group.

In other words, the richest one percent of Americans are not paying a disproportionate share of taxes, and the tax changes that took effect this year did not make a dramatic difference.

Taxes that Have Changed in 2013

The taxes that have gone up in 2013 (but which would not have gone up if Congress had extended all 2012 federal tax laws) include the following:

Personal income tax rates and limits on exemptions and deductions.
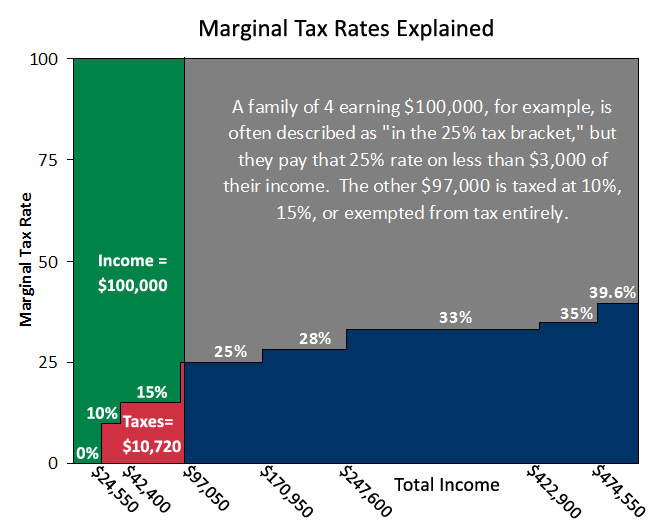
Under the fiscal cliff deal, two parts of the personal income tax cuts originally enacted under President George W. Bush were allowed to partially expire for the rich. The first is the reduction in the top income tax rate from 39.6 percent to 35 percent. The rate was allowed to revert back to 39.6 percent for married couples with taxable income greater than $450,000 and singles with taxable income greater than $400,000. The second is the personal exemption phase-out and the limitation on itemized deductions (often called “PEP and Pease”) which were allowed to come back into effect for married couples with adjusted gross income (AGI) greater than $300,000 and singles with AGI greater than $250,000.

Hospital Insurance (HI) taxes on income of the wealthy.
Two increases in the Medicare Hospital Insurance (HI) tax were enacted as part of President Obama’s major health care reform law, and the fiscal cliff deal did nothing to prevent them from taking effect in 2013 as scheduled.

Before 2013, the HI tax was a 2.9 percent tax on earnings. (Technically employed people directly pay half the tax while their employer directly pays the other half, but economists agree that the worker ultimately bears even the latter half of the tax in the form of reduced wages and benefits.)

One increase in the HI tax is the introduction of a higher rate (3.8 percent) for earnings above $250,000 for a married couple and above $200,000 for a single person (in other words, an additional 0.9 percent tax on earnings above these levels). The other increase allows the HI tax to apply to most types of investment income (which had been exempt from the HI tax until now) besides retirement income. This part of the tax is a 3.8 percent tax on investment income to the extent that it makes up a taxpayer’s AGI in excess of $250,000 for a married couple or $200,000 for a single person.

Social Security payroll taxes.
The Social Security payroll tax is normally 12.4 percent of earnings, up to a cap that is adjusted for wage growth each year. (This year the tax applies to a worker’s earnings up to $113,700.) Half the tax is paid directly by employees while the other half is paid directly by employers. (Again, economists agree that even the latter half of the tax is ultimately borne by employees.) The tax takes up a larger percentage of income for the typical low- or middle-income worker than it does for a high-income person because of the wage cap and also because high-income people are more likely to receive a portion of their income in the form of investment income, which is not subject to this tax.

In 2012, a payroll tax “holiday” was in effect which reduced the Social Security tax to 10.4 percent. (Technically, the part of the tax paid directly by employees was reduced from 6.2 percent to 4.2 percent.) The fiscal cliff deal did not extend the payroll tax holiday, meaning the tax rate reverted to 12.4 percent in 2013.

Why Have Some Observers and News Reports Claimed that the Poor Pay Little or Nothing While the Rich Pay a Disproportionate Share of Taxes?

Some political commentators and some major media outlets have reported that low- and middle-income Americans pay little or no taxes while the rich pay a hugely disproportionate share of taxes, and that this is especially the case in 2013 as a result of the fiscal cliff deal.

Sometimes this misconception occurs because people erroneously focus only on the federal personal income tax, which is the most progressive major tax we have. In other instances, thoughtful people do look at all of the federal taxes Americans pay, but ignore state and local taxes and measure income in a way that is incomplete. The next two sections address each of these sources of confusion.

The Federal Personal Income Tax Is Progressive, But Most Other Taxes that Americans Pay Are Regressive

In April 2009, estimates released by the Urban-Brookings Tax Policy Center (TPC) created a tsunami of misunderstanding that raged for years and finally crested during the presidential campaign of Mitt Romney in 2012. The figures released by TPC in 2009 showed that nearly 43.4 percent of Americans would have “zero or negative tax liability” that year.[1]

Close examination of the table containing the figures made clear that TPC had estimated 43.4 percent of Americans would not pay federal personal income taxes that year. It was certainly not saying that this group would not pay other federal taxes or state and local taxes.

But that was largely lost in the months that followed. A news article about the figures quoted a TPC senior fellow saying, “You’ve got a larger and larger share of people paying less and less for the services provided by the federal government. The concern is that the majority can say, ‘Let’s have more benefits, spend more,’ if they’re not paying for it. It’s ‘free.’ That’s not a good thing to have.”[2]

A TPC update in June of that year increased its estimate to 46.9 percent — nearly 47 percent of Americans.[3]

Flash forward to the presidential campaign trail in 2012, where Mitt Romney famously told a room full of donors, during what he believed to be an off-record event,

“There are 47 percent of the people who will vote for the president no matter what. All right, there are 47 percent who are with him, who are dependent upon government, who believe that they are victims, who believe the government has a responsibility to care for them, who believe that they are entitled to health care, to food, to housing, to you-name-it… These are people who pay no income tax.”[4]

For several years, Citizens for Tax Justice has estimated the total federal, state and local taxes paid by Americans in each income group. We’ve found that no one group is getting a free-ride and that the tax system overall is just barely progressive. For example, the table above shows that the poorest fifth of Americans (the “lowest 20%”) will pay 2.1 percent of the total (federal, state and local) taxes in America in 2013. The table also shows that this same group will only receive 3.3 percent of the total income in the country this year. So the poorest fifth of Americans do pay a share of taxes that is lower than their share of total income, but not dramatically lower.

Likewise, the richest one percent of Americans in 2013 will pay 24 percent of total taxes and receive 21.9 percent of total income. In other words, the share of taxes paid by the richest Americans is slightly greater than their share of total income, but not dramatically so.

The table also shows that the tax changes that took effect this year did not dramatically alter this distribution of America’s taxes.

Incomplete Measures of Income Result in Incomplete Measures of Distribution of Taxes

There is no comprehensive source for estimates of state and local taxes other than those generated by CTJ’s partner organization, the Institute on Taxation and Economic Policy (ITEP). The figures in this report and the accompanying fact sheet, which incorporate state and local tax estimates from ITEP, are therefore the only real estimates of the total taxes paid in America.

Some analysts do at least estimate total federal taxes. However, when these analysts estimate effective federal tax rates for all federal taxes, they typically come up with figures that are different from ITEP’s estimates of effective federal tax rates. This is often because these analysts are estimating income in a way that is less comprehensive than the method used by ITEP.

An incomplete estimate of income affects the calculation of effective tax rates, which are taxes divided by income. For example, imagine that two economists agree that a group of people paid $500,000 in taxes one year, but disagree about the amount of income this group received during the year. One economist believes the group of people received $1 million in income and therefore had an effective tax rate of 50 percent. The other economist believes the group of people received income of $2 million and therefore had an effective tax rate of 25 percent.

Disagreements about measuring income in America today are not as dramatic as in this example, but they nonetheless lead to different estimates of effective federal tax rates.

Specifically, some analysts assume that the income reported by high-income taxpayers to the IRS is essentially equal to all of the income that these taxpayers have. However, many kinds of income are not included in federal adjusted gross income, but are nonetheless real income.

In estimating taxpayers’ income, ITEP begins with the adjusted gross income (AGI) reported by taxpayers to the IRS and then adds sources of income that are not included in AGI. For the bottom three-fifths of Americans this additional income primarily reflects untaxed transfers, most notably non-taxable Social Security benefits. In the top income group (the top one percent), the additional income primarily reflects ITEP’s conservative estimates of unreported and unrealized capital gains and understated business income.

For the income groups in between, additional income includes the above items, but the difference is much smaller than it is in the lower and top income groups, because wages subject to withholding dominate the total income of taxpayers in these in-between groups.

As a result of these adjustments, the income concept ITEP uses to separate taxpayers into income groups and to calculate effective tax rates is bigger than the income reported on tax returns. By our measure of income, in the bottom three quintiles, 75 percent of total income is reported as part of AGI on tax returns. In the top income group, 78 percent of total income is reported as AGI on tax returns. In the in-between groups, 91 percent of total income is reported as AGI on tax returns. The overall average is 85 percent.

This definition of income is one that most people understand. For example, Social Security recipients know that they receive Social Security benefits even if some or all of those benefits are not taxable. Likewise, high-income investors know that the capital gains they report on their tax returns are generally considerably less than the capital gains they actually enjoy. This means that people can look at ITEP’s estimates for different income groups and easily identify which income group they fall into.

One final note: Effective tax rates are calculated as taxes divided by income. The income definition that ITEP uses to calculate effective tax rates when all taxes are included in the analysis is the definition of income just described, plus two adjustments to account for sources of income recognized by all economists (even if not entirely understood by most people trying to determine which income group they belong to).

First, in computing effective Social Security and Medicare tax rates we (like virtually all analysts) count both the employee and employer shares of these taxes. But that logically requires including the employer share of the taxes in income (as well as in taxes) in calculating effective tax rates.[5] Second, since we include corporate income taxes, attributed to investors, in our total tax calculations, we also include in income, for purposes of calculating effective tax rates, pretax corporate profits (of non-pass-through corporations), net of taxable dividends paid to individual shareholders.[6] These two adjustments increase the total income used for calculating effective tax rates by an average of 14 percent.


[1] Tax Policy Center, Table T09-0202: Tax Unites with Zero or Negative Tax Liability, 2009-2019, April 14, 2009. http://www.taxpolicycenter.org/numbers/displayatab.cfm?Docid=2276&DocTypeID=7

[2] Declan McCullagh, “The Income Tax System is Broken,” CBS News, April 15, 2009. http://www.cbsnews.com/2100-503363_162-4945874.html

[3] Tax Policy Center: Table T09-0334: Distribution of Tax Units with Zero or Negative Individual Income Tax Liability by Cash Income Level, June 19, 2009. http://www.taxpolicycenter.org/numbers/displayatab.cfm?Docid=2409

[4] David Corn, “SECRET VIDEO: Romney Tells Millionaire Donors What He REALLY Thinks of Obama Voters,” Mother Jones, September 17, 2012. http://www.motherjones.com/politics/2012/09/secret-video-romney-private-fundraiser

[5] Economists generally agree that the part of the payroll tax that is paid directly by employers is a portion of the employee’s income that would have been paid to the employee (in the form of higher wages or benefits) but is instead paid to the federal government as taxes.

[6] Some analysts do not attribute pretax corporate profits to investors, even though they do count corporate income taxes as ultimately paid by investors in computing effective tax rates. These analysts assume that all corporate profits eventually show up in individuals’ incomes, either as taxable dividends (which we do subtract from pretax corporate profits) or taxable capital gains. We believe that this assumption is unwarranted. since most individual capital gains show up either in retirement benefits, on which the effective individual tax rate is zero or less or are never realized or reported (in part due to the rule that exempts capital gains on inherited assets from tax forever). Contributions to retirement funds (pensions, 401k’s, etc.) are not taxable as earnings when the contributions are made, thus avoiding both income and payroll taxes. Distributions during retirement are taxable. But, assuming a constant tax rate, this is the mathematical equivalent of taxing the contributions when made and exempting the distributions from tax. (This is why analysts treat tax-deductible IRA contributions as the equivalent of “Roth IRAs,” where the contributions are not deductible, but the distributions are tax-exempt.) In fact, since tax rates on retirement distributions from pensions, 401k’s, etc. are likely to be taxed at a lower tax rate than the tax rate avoided by the tax exemption for contributions, the actual tax rate on retirement income is likely to be negative.


    Want even more CTJ? Check us out on Twitter, Facebook, RSS, and Youtube!

Who Loses Which Tax Breaks Under President Obama’s Proposed Limit on Tax Expenditures?

March 29, 2013 01:33 PM | | Bookmark and Share

The Deduction for State and Local Taxes Tops the List of Items Obama Would Limit

Read this report in PDF.

President Obama has proposed to limit the tax savings for wealthy taxpayers from itemized deductions and certain other deductions and exclusions to 28 cents for each dollar deducted or excluded. This proposal would raise more than half a trillion dollars in revenue over the up­coming decade.[1] Despite this large revenue gain, only 2.4 percent of Americans would receive a tax increase under the plan in 2014, and their average tax increase would equal just 1 percent of their income.

The deduction for state and local taxes would make up over a third of the total tax expenditures limited by the proposal. In combination, the deduction for state and local taxes and the deduction for charitable giving would make up more than half of the tax expenditures limited.

The proposal would apply only to taxpayers with adjusted gross income (AGI) above $250,000 for married couples and above $200,000 for singles.

The proposal is a way of limiting tax expenditures for the wealthy. The term “tax expenditures” refers to provisions that are government subsidies provided through the tax code. They have the same effect as direct spending subsidies (because the Treasury ends up with less revenue and some individual or group receives money) but are sometimes less noticed because they’re implemented through the tax code.

Under current law, there are three income tax brackets with rates higher than 28 percent (the 33, 35, and 39.6 percent brackets). People in these tax brackets could therefore lose some tax breaks under the proposal. (Some people with AGI below $250,000/$200,000 could be in the 33 percent tax bracket but would be exempt from the proposal.)[2]

Currently, a high-income person in the 39.6 percent income tax bracket saves almost 40 cents for each dollar of deductions or exclusions. An individual in the 35 percent income tax bracket saves 35 cents for each dollar of deductions or exclusions, and a person in the 33 percent bracket saves 33 cents. The lower tax rates are 28 percent or less. Many middle-income people are in the 15 percent tax bracket and therefore save only 15 cents for each dollar of deductions or exclusions.

This matters because tax deductions and exclusions are types of tax expenditures used by Congress to subsidize certain activities, like giving to charity, borrowing to buy a home, or buying bonds from state and local governments. If Congress provided such subsidies through direct spending, there would likely be a public outcry over the fact that rich people are subsidized at higher rates than low- and middle-income people. But because these subsidies are provided through the tax code, this fact has largely escaped the public’s attention.     

President Obama initially presented his proposal to limit tax expenditures in his first budget plan in 2009, and included it in subsequent budget and deficit-reduction plans each year after that. The original proposal applied only to itemized deductions. The President later expanded the proposal to limit the value of certain “above-the-line” deductions (which can be claimed by taxpayers who do not itemize) like the deduction for health insurance for the self-employed and the deduction for contributions to individual retirement accounts (IRA). [3]

The proposal was also expanded to include certain tax exclusions, like the exclusion for interest on state and local bonds and the exclusion for employer-provided health care. Exclusions provide the same sort of benefit as deductions, the only difference being that they are not counted as part of a taxpayer’s income in the first place (and therefore do not need to be deducted).

Exempting the Charitable Deduction from the Limit Would Reduce the Revenue Impact by 19 Percent

Any proposal to limit tax expenditures gives rise to a debate about which tax expenditures should be subject to such a limit and which should be exempt. For example, some charities have objected to the limit applying to the deduction for charitable giving, on the mistaken view that limiting this deduction would significantly reduce charitable giving.[4]

Excluding a tax expenditure from the proposed limit may reduce the revenue impact of the proposal slightly more than or less than the corresponding percentage in the table on the first page.

For example, while the table on the first page illustrates that the charitable deduction makes up 17 percent of the tax breaks that would be limited under the President’s proposal, exempting the charitable deduction from the limit would actually reduce the revenue impact by 19 percent. While the table on the first page illustrates that the deduction for state and local taxes makes up 37 percent of the total tax breaks limited by the proposal, exempting this deduction from the limit would reduce the revenue impact of the proposal by 34 percent. The reason for these slight differences has to do with interaction between various tax provisions.

Exempting the Charitable Deduction from the Proposed Limit would Largely Turn the Remaining Proposal into a Limit on the Deduction for State and Local Taxes

Some tax-exempt organizations, particularly universities and museums, have expressed fear that the limitation on the charitable deduction will result in less charitable giving. Research suggests this fear is unfounded.[5] But another point that has received little attention is that amending the President’s proposal to “carve out” the charitable deduction would concentrate the effects of the proposal even more on the deduction for state and local taxes — which is the most justifiable of all the tax breaks the President proposes to limit.

The deduction for state and local taxes paid is sometimes seen as a subsidy for state and local governments because it effectively transfers the cost of some state and local taxes away from the residents who directly pay them and onto the federal government. For example, if a state imposes a higher income tax rate on residents who are in the 39.6 percent federal income tax bracket, that means that each dollar of additional state income taxes could reduce federal income taxes on these high-income residents by almost 40 cents. The state government may thus be more willing to enact the tax increase because its high-income residents will really only pay 60 percent of the tax increase, while the federal government will effectively pay the remaining 39.6 percent.

But viewed a different way, the deduction for state and local taxes is not a tax expenditure at all, but instead is a way to define the amount of income a taxpayer has available to pay federal income taxes. State and local taxes are an expense that reduces one’s ability to pay federal income taxes in a way that is generally out of the control of the taxpayer. A taxpayer in a high-tax state has less income to pay federal income taxes than a taxpayer with the same pre-tax income but residing in a low-tax state.

Another argument in favor of the itemized deduction for state and local taxes paid is that the public investments funded by state and local taxes produce benefits for the entire nation. This can be seen as a justification for the deduction for state and local taxes paid because it encourages state and local governments to raise the tax revenue to fund these public investments that the jurisdictions might otherwise not make. 

For example, state and local governments provide roads that, in addition to serving local residents, facilitate interstate commerce. State and local governments also provide education to those who may leave the jurisdiction and boost the skill level of the nation as a whole, boosting the productivity of the national economy. State and local governments may have an incentive to provide less of these public investments than is optimal for the nation because the benefits partly go to those outside the jurisdiction. The deduction for state and local taxes may counter this inclination of state and local governments to under-invest in these areas.


[1] A recent CTJ report explains that the Treasury is likely to estimate that the President’s proposal to limit tax expenditures for the wealthy would raise $583 billion over a decade while the Congressional Joint Committee on Taxation (JCT) is likely to estimate that it will raise $513 billion over a decade. See Citizens for Tax Justice, “Working Paper on Tax Reform Options: End Tax Sheltering of Investment Income and Corporate Profits and Limit Tax Breaks for the Wealthy,” February 4, 2013. http://ctj.org/ctjreports/2013/02/working_paper_on_tax_reform_options.php

[2] Many of the wealthy taxpayers whose deductions and exclusions are targeted by the proposal would also experience a change in their alternative minimum tax (AMT). The AMT is a backstop tax, meaning it forces well-off people who effectively reduce their taxable income with various deductions and exclusions to pay some minimal tax. If a tax change only increases the regular income tax and not the AMT, some taxpayers who currently pay AMT will not be affected at all. Very generally, one of the AMT changes in the proposal essentially ensures that the increase in a taxpayer’s regular income tax would also be applied to the AMT to ensure that the tax increase shows up on the final income tax bill. The other AMT change would limit the savings for each dollar of deductions or exclusions to 28 cents for those whose income is within the “phase-out range” for the exemption that prevents most people from being affected by the AMT. The impacts of these changes are included in the estimates shown here.

[3] The most recent description of the proposal provided by the Obama administration can be found in Department of the Treasury, “General Explanations of the Administration’s Fiscal Year 2013 Revenue Proposals,” February 2012, page 73. http://www.treasury.gov/resource-center/tax-policy/Pages/general_explanation.aspx 

[4] For example, see Joseph Cordes, “Effects of Limiting Charitable Deductions on Nonprofit Finances,” presentation given February 28, 2013 at the Urban Institute. Cordes finds that the President’s proposal to limit the tax savings of each dollars of deductions and exclusions to just 28 cents would reduce charitable giving by individuals by between 2.1 percent and 4.1 percent, and the actual loss of total charitable giving would be smaller because some charitable contributions are made by foundations, corporations and other entities rather than individuals affected by this proposal.  http://www.urban.org/taxandcharities/upload/cordesv5.pdf  

[5] Id.


    Want even more CTJ? Check us out on Twitter, Facebook, RSS, and Youtube!

Paul Ryan’s Latest Budget Plan Would Give Millionaires a Tax Cut of $200,000 or More

March 13, 2013 02:40 PM | | Bookmark and Share

Read this report in PDF.

House Budget Chairman Paul Ryan’s budget plan for fiscal year 2014 and beyond includes a specific package of tax cuts (including reducing income tax rates to 25 percent and 10 percent) and no details on how Congress would offset their costs, all the while proposing to maintain the level of revenue that will be collected by the federal government under current law.

The revenue loss would 
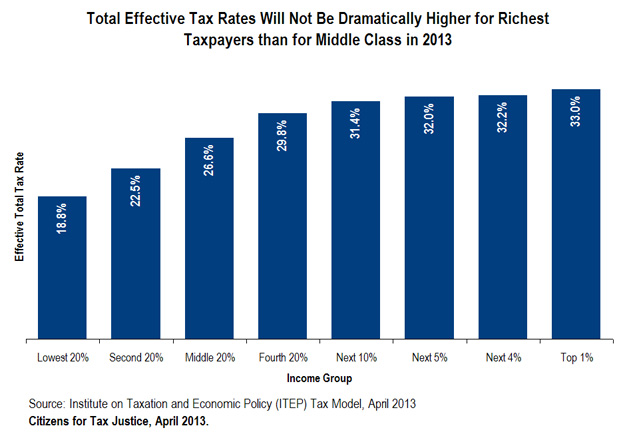
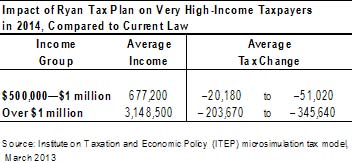
presumably be offset by reducing or eliminating tax expenditures (tax breaks targeted to certain activities or groups), as in his previous budget plans. For taxpayers with income exceeding $1 million, the benefit of Ryan’s tax rate reductions and other proposed tax cuts would far exceed the loss of any tax expenditures. In fact, under Ryan’s plan taxpayers with income exceeding $1 million in 2014 would receive an average net tax decrease of over $200,000 that year even if they had to give up all of their tax expenditures. These taxpayers would see an even larger net tax decrease if Congress failed to limit or eliminate enough tax expenditures to offset the costs of the proposed tax cuts.

Given that Ryan’s plan specifies how taxes would be cut, but not how tax expenditures would be reduced to offset the costs, it is nearly impossible to estimate the impacts on taxpayers in most income groups. However, for very high-income taxpayers, it is possible to estimate a range of impacts, with one extreme being a scenario in which these taxpayers must give up all tax expenditures, and the other extreme being a scenario in which they give up no tax expenditures.[1]

The table above illustrates these two possible scenarios by including estimates of the minimum and maximum average net tax cuts that high-income taxpayers could receive in 2014 under Chairman Ryan’s plan. Because these very high-income taxpayers would pay less than they do today in either scenario, the average net impact of Ryan’s plan on some taxpayers at lower income levels would necessarily be a tax increase in order to fulfill Ryan’s goal of collecting the same amount of revenue as expected under current law.

The estimates of the minimum average net tax cuts assume that wealthy taxpayers would have to give up all of the tax expenditures that benefit them directly — except the huge breaks for investing and saving, which Ryan has pledged in the past to leave in place.[2] These tax breaks for investing and saving, particularly the lower tax rates for capital gains and stock dividends, provide the greatest benefits to the richest taxpayers. The estimates of the minimum average tax cuts also assume that the reduction in the corporate income tax rate would be offset by the elimination or reduction in tax expenditures that benefit businesses.

The estimates of the maximum average net tax cuts, on the other hand, assume that no tax expenditures are eliminated or reduced. The maximum average net tax breaks are what high-income taxpayers would receive if Congress enacts the specific tax cuts proposed in Ryan’s plan with no provisions to offset the revenue loss by limiting tax expenditures.

Chairman Ryan’s budget plan lays out (on page 24) the following “solutions” for our tax system:

• Simplify the tax code to make it fairer to American families and businesses.
• Reduce the amount of time and resources necessary to comply with tax laws.
• Substantially lower tax rates for individuals, with a goal of achieving a top individual rate of 25 percent.
• Consolidate the current seven individual-income-tax brackets into two brackets with a first bracket of 10 percent.
• Repeal the Alternative Minimum Tax.
• Reduce the corporate tax rate to 25 percent.
• Transition the tax code to a more competitive system of international taxation [widely understood to mean a territorial tax system].

Elsewhere the plan makes it clear (on page 54, for example) that the Affordable Health Care for America Act (President Obama’s major health care reform) would be repealed. This means the plan would repeal tax increases that were part of the health reform law, including a significant provision reforming the Medicare Hospital Insurance (HI) tax so that it has a higher rate for high-income earners and no longer exempts the investment income of wealthy taxpayers.

Despite all of these proposed tax cuts, Chairman Ryan’s plan also proposes to somehow maintain the level of revenue that will be collected by the federal government under current law.[3]

Ryan’s Budget Plan Is Not Meaningfully Different from His Previous Budget Plans

It has been noted that Chairman Ryan’s plan for fiscal year 2014 accepts the level of revenue that the federal government is projected to collect under current law, which includes the recent New Year’s Day deal addressing the “fiscal cliff” by letting some tax rates go up for the very rich and also includes the revenue raised in the Affordable Health Care for America Act. But this is far less impressive than it might sound, for two reasons.

First, Ryan’s plan includes the same revenue-reducing measures — the same tax rate reductions, the same repeal of the AMT, and the same repeal of health care reform — as his previous budget plans. Chairman Ryan simply leaves it to others to decide what tax expenditures to reduce or eliminate to make the entire package revenue-neutral compared to current law.[4]

Second, even the current law level of revenue is widely recognized to be inadequate to meet our nation’s needs. Ryan’s plan notes that under current law, federal revenue will equal 19.1 percent of GDP (19.1 percent of the overall economy) in 2023, and observers have noted that this is more than his previous budgets allowed.[5] But this level of revenue would not have balanced the budget even during the Reagan administration, when federal spending ranged from 21.3 percent to 23.5 percent of GDP. [6] That was at a time when America was not fighting any wars, the baby-boomers were not retiring, and health care costs had not yet skyrocketed the way they have today.

Chairman Ryan’s refusal to raise any more revenue is why his plan must rely on enormous cuts in public investments in order to balance the budget. As others have noted, Ryan’s plan cuts the number of people with health insurance by 40 to 50 million people, cuts $800 billion from the mandatory programs that mostly serve the poor (like Pell Grants, food assistance, the EITC, and Temporary Assistance for Needy Families) and cuts $700 billion from non-defense discretionary spending (like education, transportation, Head Start and housing assistance).[7] Ryan’s budget plan does all this while providing an annual tax cut of at least $200,000 to those with incomes exceeding $1 million.


Tax Provisions of the Ryan Budget for Fiscal Year 2014


Specified in Plan


Filling in the Blanks


Income Tax Rates on Ordinary Income


Two rates, 10% and 25%.


The goal of the Ryan plan is to reduce rates, not raise them, so we assume that income tax rates currently higher than 25% will be replaced with the 25% rate while rates below 25% will all become 10%.


Capital Gains and Dividends


Nothing, except to cite the alleged “double taxation of capital and investment” as one of three factors that “combine to suppress innovation, job creation, and economic growth.” Chairman Ryan’s previous budget plan specifically objected to “raising taxes on investing,”


Currently, the tax brackets in which ordinary income is taxed at 25% and 10% have a 15% and 0% rate, respectively, for capital gains/dividend income. We therefore assume the 25% and 10%  brackets in the Ryan plan would have 15% and 0% rates for capital gains and dividends. We do not assume a 20% rate for capital gains and dividends for those with taxable income above $450,000/$400,000 as in current law because this would require a third tax bracket, contradicting Ryan’s goal of having just two brackets.


Tax Expenditures for Individuals


Nothing, except to say that the goal should be to “simplify the tax code” and “reduce the amount of time and resources necessary to comply with tax laws.” Ryan’s previous budget explicitly called for reducing or eliminating tax expenditures to offset the costs of the proposed tax cuts.


To calculate our minimum average net tax cuts, we assume that the very rich must give up all itemized deductions, all credits, the exclusion for employer-provided health care, and the deduction for health care for the self-employed. To calculate our maximum average net tax cuts, we assume none of these tax expenditures are reduced at all.


Hospital Insurance (HI) tax increase in health reform


The plan makes clear that the health reform law would be repealed.


We assume the HI tax reform that was enacted as part of the health reform law would be repealed.


Corporate Tax Statutory Rate


Cut to 25%


We assume corporate tax cuts ultimately are borne by the owners of capital (corporate stocks and other business assets) about half of which are concentrated in the hands of the richest one percent.


Corporate Tax Treatment of Offshore Profits


“Transition the tax code to a more competitive system of international taxation”


This is widely understood to refer to a “territorial” system, meaning a tax system that exempts offshore profits from taxes.


Tax Expenditures for Business


The plan decries the complexity that is generally caused by tax expenditures. It says that “American corporations engage in elaborate tax planning because the current tax code puts them at a competitive disadvantage compared to their foreign competitors,” and that “companies engage in complex transactions purely to reduce their tax burden even when these schemes divert resources from more productive investments.”


To calculate the minimum average net tax cuts, we assume that enough would be eliminated to offset corporate rate cuts and the transition to a territorial system. To calculate the maximum average net tax cut, we assume no tax expenditures are reduced or eliminated.


[1] Some of the details that need to be filled in for Ryan’s plan would have little effect on the tax bills of very high-income taxpayers. For example, Ryan’s plan does not specify the level of taxable income at which the 10 percent rate would end and the 25 percent rate would begin, and it says nothing about standard deductions and personal exemptions. We assume that all income tax rates currently above 25 percent are replaced with the 25 percent rate, and all rates below the current 25 percent rate are replaced with the 10 percent rate. We also assume no change to standard deductions and personal exemptions. These assumptions make little difference for very high-income taxpayers, because the vast majority of their income would be taxed at the 25 percent rate in any event under Ryan’s plan. But these details could dramatically impact the tax liability of low- and middle-income taxpayers.

[2] The budget plan for fiscal year 2014 does not specify how special income tax rates for investment income and special breaks for savings and investment will be treated, but does cite the alleged “double taxation of capital and investment” as one of three factors that “combine to suppress innovation, job creation, and economic growth.” Ryan’s previous budget plan specifically objected to “raising taxes on investing,” making it extremely difficult to believe Ryan would propose to do so the very next year.

[3] The table on page 78 shows no revenue change, compared to “current policy.” Then the table on page 81 provides the “cross-walk” from CBO’s baseline to what Ryan calls “current policy.” For revenue, the difference is zero dollars.

[4] Chairman Ryan seems eager to specify the tax cuts in his plan, but when it comes to paying for those tax cuts, he becomes deferential to the House Ways and Means Committee (the tax-writing committee). Ryan’s plan claims that it “accommodates the forthcoming work by House Ways and Means Committee Chairman Dave Camp of Michigan. It provides for floor consideration of legislation providing for comprehensive reform of the tax code.” The portion of Ryan’s plan describing tax reform cites, and is nearly identical to, a letter from Camp describing the tax reform Ways and Means Republicans will pursue. Everything described in the letter is consistent with the tax provisions Ryan has proposed in his previous budget plans. Letter from House Ways and Means Committee Republicans to House Budget Committee Chairman Paul Ryan, http://budget.house.gov/uploadedfiles/fy14budgetletterwm.pdf

[5] Suzy Khimm, “Paul Ryan Wants More Revenue,” Washington Post Wonkblog, March 12, 2013. http://www.washingtonpost.com/blogs/wonkblog/wp/2013/03/12/paul-ryan-wants-more-revenue/

[6] Office of Management and Budget, Historical Tables, Table 1.2. http://www.whitehouse.gov/omb/budget/Historicals/

[7] Statement by Robert Greenstein, President, On Chairman Ryan’s Budget Plan, Center on Budget and Policy Priorities, March 12, 2013. http://www.cbpp.org/cms/index.cfm?fa=view&id=3920


    Want even more CTJ? Check us out on Twitter, Facebook, RSS, and Youtube!