August 31, 2000 12:51 PM | Permalink | ![]()
Click here to see this analysis in PDF format.
Democratic presidential candidate Al Gore has proposed a collection of targeted tax breaks that he says will cost a total of $500 billion over the next decade. The proposals include:
- Increasing the standard deduction for married couples to double the single level.
- Boosting the earned-income tax credit for two-earner couples and families with three or more children.
- A 25 percent refundable tax credit for people lacking access to employer-based health insurance who purchase coverage in the individual market.
- Big increases in tax credits for dependent care expenses, including making it refundable for families that don’t owe income taxes, increasing the percentage credits to up to 50% from the current 20%, offering an extra credit for infants (up to $250), even if there are no day care expenses, and expanding the credit to children up to age 16 (from 12 now).
- A tax credit of up to $3,000 for long-term care expenses.
- Expanding the current $2,000 college tax credit to $2,800 and making it available at somewhat higher income levels.
- Major new tax breaks for savings accounts for retirement, college and first time home purchases. Under Gore’s plan, the government would match an individual’s contribution to such an account by up to 370 percent, depending on income level. When fully phased in (in 2009), the maximum annual addition to an account would be $2,000 for individuals and $4,000 for couples.
- For individuals making less than $15,000, a personal contribution of $425 would be matched by a refundable tax credit and deduction to bring the total to $2,000.
- For individuals making between $15,000 and $30,000, an $850 contribution would be supplemented by $1,150 in tax breaks to get $2,000 into an account.
- And for individuals making between $30,000 and $50,000, it would take an individual contribution of $1,080 plus tax breaks of $920 to reach the $2,000 maximum.
- For couples, the income levels (as well as the $2,000 annual account limit) would be doubled.
- Tax credits for energy efficient products (to both individual and businesses).
- Tax breaks for companies that engage in research.
- Tax breaks for smaller companies that purchase health insurance for their employees.
- An increase in the estate tax exemption to $5 million for couples (half that for singles).
Due to data constraints and other problems, we have not yet been able to do a distributional analysis of the Gore proposals. Because most of the proposals are limited to taxpayers below certain income levels, however, it seems clear that the bulk of the proposed tax breaks would go to middle- and lower-income taxpayers.
The following table shows the maximum income cutoffs for the Gore proposals, where applicable.
| Income limits for Gore tax cuts | |||
| Personal items | Singles | Couples | Notes |
| Earned-income tax credit changes | 35,600 | 37,000 | |
| Health insurance personal credits | Mostly lower end | Only for those without employer paid insurance | |
| Dependent care credit rates | 60,000 | 60,000 | (not counting indexing, increase in age limit and infant credit, which are not capped) |
| Retirement Savings Plus | 50,000 | 100,000 | |
| Married standard deduction | na | 100,000 | 94% under $100K, 80% under $75K |
| Education credits | 60,000 | 120,000 | Phase outs end |
| Long-term care credit | 75,000 | 110,000 | Phase outs start |
| Long-term care credit | 135,000 | 170,000 | Phase outs end (generally) |
| Tax credits for buying efficient products | no upper limit | ||
| Estate tax cuts | no upper limit | All in top few percent | |
| Business items | |||
| Business health insurance credits | Limited to businesses below a certain size | ||
| R&E tax credit | No limit (almost all large corporations) | ||
| Energy-efficiency business credits | No limit | ||
Proposed Changes to the Earned-Income Tax Credit:
| Current Law 2000 levels |
3+ kids | Everyone | ||||||
| (like 2+) | 2+ kids | 1 kid | no kids | |||||
| Max base | $ 9,720 | $ 9,720 | $ 6,920 | $ 4,610 | ||||
| Rate | 40% | 40% | 34% | 7.65% | ||||
| Max credit | 3,888 | 3,888 | 2,353 | 353 | ||||
| PO rate | 21.06% | 21.06% | 15.98% | 7.65% | ||||
| PO start | 12,690 | 12,690 | 12,690 | 5,770 | ||||
| PO end | 31,149 | 31,149 | 27,413 | 10,380 | ||||
| Proposed 2000 levels |
All but 2-earner couples | 2-earner couples | ||||||
| 3+ kids | 2 kids | 1 kid | no kids | 3+ kids | 2 kids | 1 kid | no kids | |
| Max base | $ 9,720 | $ 9,720 | $ 6,920 | $ 4,610 | $ 9,720 | $ 9,720 | $ 6,920 | $ 4,610 |
| Rate | 45% | 40% | 34% | 7.65% | 45% | 40% | 34% | 7.65% |
| Max credit | 4,374 | 3,888 | 2,353 | 353 | 4,374 | 3,888 | 2,353 | 353 |
| PO rate | 19.06% | 19.06% | 15.98% | 7.65% | 19.06% | 19.06% | 15.98% | 7.65% |
| PO start | 12,690 | 12,690 | 12,690 | 5,770 | 14,140 | 14,140 | 14,140 | 7,220 |
| PO end | 35,636 | 33,086 | 27,413 | 10,380 | 37,086 | 34,536 | 28,863 | 11,830 |
| Changes | ||||||||
| Max base | — | — | — | — | — | — | — | — |
| Rate | +5% | — | — | — | +5% | — | — | — |
| Max credit | +486 | — | — | — | +486 | — | — | — |
| PO rate | –2% | –2% | — | — | –2% | –2% | — | — |
| PO start | — | — | — | — | +1,450 | +1,450 | +1,450 | +1,450 |
| PO end | +4,486 | +1,937 | — | — | +5,936 | +3,387 | +1,450 | +1,450 |
| Benefits start at income of | $ 1 | $ 12,690 | na | na | $ 1 | $ 12,690 | $ 12,690 | na |
| End at | $ 35,636 | $ 33,086 | na | na | $ 37,086 | $ 34,536 | $ 28,863 | na |
Matching Rules for Gore Savings Plans:
| Income | Govt Match |
Max govt amount | Max total (x2 for mfj) | Ind. contributes (max) | ||||||||
| Couples | Others | thru 06 | 07-08 | 2009 | thru 06 | 07-08 | 2009 | thru 06 | 07-08 | 2009 | ||
| Less than | 30,000 | 15,000 | 300% | 750 | 1,125 | 1,500 | 1,000 | 1,500 | 2,000 | 250 | 375 | 500 |
| Up to | 60,000 | 30,000 | 100% | 500 | 750 | 1,000 | 1,000 | 1,500 | 2,000 | 500 | 750 | 1,000 |
| Up to | 100,000 | 50,000 | 33% | 250 | 375 | 500 | 1,000 | 1,500 | 2,000 | 750 | 1,125 | 1,500 |
| Counting deductibility of contribution | ||||||||||||
| Less than | 30,000 | 15,000 | 371% | 788 | 1,181 | 1,575 | 1,000 | 1,500 | 2,000 | 213 | 319 | 425 |
| Up to | 60,000 | 30,000 | 135% | 575 | 863 | 1,150 | 1,000 | 1,500 | 2,000 | 425 | 638 | 850 |
| Up to | 100,000 | 50,000 | 85% | 460 | 690 | 920 | 1,000 | 1,500 | 2,000 | 540 | 810 | 1,080 |
Dependent Care Credit Changes:
- The credit would be refundable in 2003 and thereafter.
- The credit rates would be increased from the current maximum of 30%, to 40% in 2003 and to 50% in 2005 and thereafter.
- The maximum expenses eligible for the credit, now $2,400 for one child and $4,800 for two or more children would be indexed for inflation starting in 2002.
- The income levels for computing the credit percentages would be indexed starting in 2002.
- Parents of infants (under 1) could add $500 to their child care expenses, even if they do not incur daycare expenses.
- The maximum age for the credit would be increased from 12 to 16.


Want even more CTJ? Check us out on Twitter, Facebook, RSS, and Youtube!
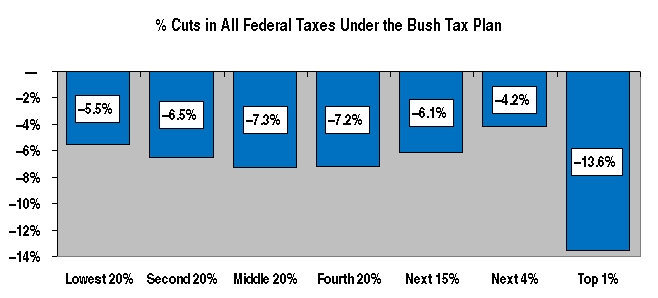 taxpayers would get nothing at all from the Bush plan. Moreover, as a share of current federal taxes, the Bush plan (as revised in May 2000) amounts to: