June 23, 1998 05:39 PM | Permalink | 
Fiscal 1998’s continuation of the strong federal tax revenue growth that began in fiscal 1993, along with severe spending restraints, makes the first federal budget surplus since the Johnson administration highly likely this year.
- Through May of this fiscal year, the federal government has run a surplus of $16 billion. CBO and OMB now expect the full fiscal year 1998 surplus to be $40 billion or more.
- The 1998 surplus so far has been driven by a $103 billion increase in revenues in fiscal 1998 through May compared to the same period in fiscal 1997. The table below shows the sources of that revenue increase through May.
- In contrast, federal spending in fiscal 1998 through May is up by only 2 percent ($21 billion) compared to the same period in fiscal 1997 (although because of calendar quirks the true spending increase is closer to 3%(1)).
Revenue Changes in Fiscal 1998 Compared to Fiscal 1997
Through May of Each Fiscal Year, $-billions
| $-change |
% change |
% of Total Increase |
| Taxes withheld from wages (income & payroll taxes) |
+$67.0 |
+9.2% |
65% |
| Other personal income tax payments |
+22.7 |
+13.0% |
22% |
| Personal income tax refunds (– = larger refunds) |
–5.1 |
+5.9% |
–5% |
| Corporate income taxes |
+6.9 |
+7.0% |
7% |
| Other taxes |
+7.0 |
+8.5% |
7% |
| Non-tax revenues (mainly Federal Reserve) |
+4.5 |
+23.2% |
4% |
| TOTAL CHANGE IN REVENUES |
+$103.0 |
+10.1% |
100% |
| Total Change in Spending |
+$21.3 |
+2.0% |
|
The “surplus,” of course, is only a surplus if one counts the build-up in the Social Security trust funds that will be needed to pay future benefits. Without the $102 billion expected 1998 surplus in the Social Security trust funds, the government is expected to spend 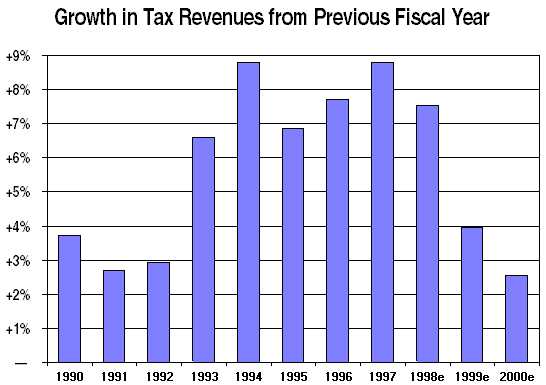 upwards of $50 billion more than it takes in this fiscal year.
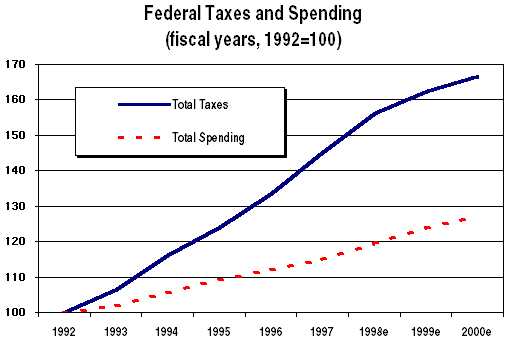
This year’s high revenue growth, although greater than was predicted when last year’s budget agreement was completed, is merely a continuation of strong revenue growth that began in 1993 (see chart). Total federal tax revenues have risen by an average of 7.7% a year since 1993, including a now anticipated rise of 7.5% in fiscal 1998 for the full year. Meanwhile, federal spending has risen by only 3% per year. Thus, the current surplus has been several years in the making.
The surge in tax revenues that began in 1993 has been driven both by the strong economy and by the upper-income tax increases that were enacted and took effect in 1993:
- The number of income tax filers has risen considerably faster than the growth in population, probably reflecting the sharp drop in unemployment.
- Personal income taxes have risen faster than total reported income, due to strong income growth.
- The 1993 tax legislation has raised more revenue than anticipated because of growth in the number and income of the affluent (and notwithstanding the significant tax cuts enacted in 1993 for low- and moderate-income working families).
Growth in Selected Items 1990 to 1998 (Estimated)
| Calendar Years |
Adjusted Gross Income |
Taxable Income |
Personal Income Tax |
Wages on Tax Returns |
# of Tax Returns |
Reported Capital Gains |
Stock Market |
| 1990 |
+4.6% |
+3.8% |
+3.2% |
+6.1% |
+1.4% |
–19.4% |
–9.8% |
| 1991 |
+1.7% |
+0.9% |
–0.4% |
+2.9% |
+0.9% |
–10.0% |
+28.3% |
| 1992 |
+4.7% |
+4.9% |
+5.9% |
+4.9% |
–1.0% |
+13.7% |
+4.7% |
| 1993 |
+2.6% |
+2.4% |
+5.3% |
+3.1% |
+0.9% |
+20.2% |
+7.7% |
| 1994 |
+4.9% |
+5.9% |
+5.6% |
+4.7% |
+1.2% |
+0.3% |
–2.9% |
| 1995 |
+7.2% |
+8.3% |
+9.5% |
+5.8% |
+2.0% |
+17.9% |
+32.3% |
| 1996p |
+8.7% |
+10.2% |
+12.3% |
+6.1% |
+2.0% |
+39.8% |
+17.4% |
| 1997e |
na |
na |
+10.1% |
na |
+2.0% |
na |
+31.5% |
| 1998e |
na |
na |
+7.8% |
na |
+2.0% |
na |
na |
| Sources: Internal Revenue Service (1996 is preliminary data); Office of Management and Budget, May 1998; New York Stock Exchange. “na” = not available. |
Although most major taxes have contributed to the rise in revenues, personal income tax revenues have grown especially rapidly in recent years. Personal income tax revenues rose by 8.1% in fiscal 1995, 10.8% in fiscal 1996, and 12.3% in fiscal 1997. Through May of this year, fiscal 1998 personal income tax revenues are up by 11.7% compared to the same period in fiscal 1997, and are now anticipated to be up by 10% for the full 1998 fiscal year. On a calendar tax-year basis, personal income taxes rose by:
- 9.5% for tax year 1995,
- 12.3% for tax year 1996, and
- based on the latest fiscal year figures and estimates, probably rose by about 10% for tax year 1997 and should rise by about 8% for tax year 1998.
Is it Capital Gains?
Some leaders in Congress see the latest tax revenue data as evidence that the 1997 reduction in capital gains tax rates has been a major cause of recent revenue growth.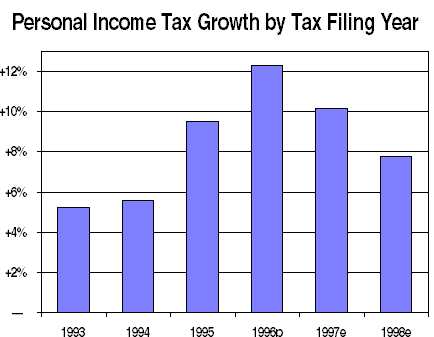 Indeed, GOP leaders are reportedly pressuring the nonpartisan analysts at the Congressional Budget Office and the Joint Committee on Taxation to adjust their tax models so that they will show an additional capital gains tax cut as a huge revenue raiser. There are several flaws in this theory, however.
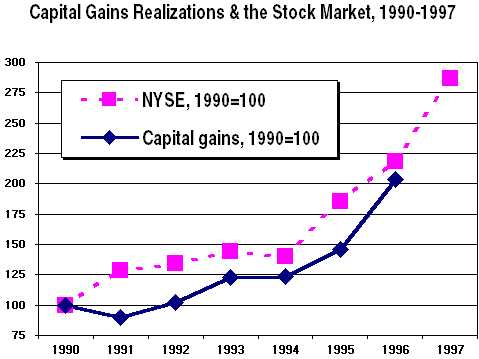
For one thing, two-thirds of the revenue increase through May of fiscal 1998 compared to fiscal 1997 has come from increased taxes withheld from wages. As for capital gains, any increase merely reflects a long-term trend, not a response to last year’s tax cut:
- Reported capital gains have risen rapidly along with the booming stock market. According to recently released preliminary data from the IRS, reported gains doubled over the calendar 1993-96 period, including an 18% increase on tax returns filed for 1995 and a huge 40% jump on 1996 tax returns. Thus, capital gains were skyrocketing long before the 1997 capital gains tax cut took effect (in May of 1997). The 65% total increase in reported gains in 1995 and 1996 was driven not by changes in tax policy, but rather by a 55% surge in the stock market.
- Because of the 1997 capital gains tax cut, reported gains in calendar 1997 will have had to continue their torrid growth pace of the previous two years just to break even with the $64 billion in capital gains taxes paid on calendar 1996 returns.
- Given the strong performance of the stock market in 1997 (up 31%), we may well discover that reported capital gains did continue to increase rapidly in 1997. (No IRS data will be available until late 1998 or early 1999.) After all, reported gains slightly outpaced the growth in the stock market in 1995 and 1996. But given the pre-tax-cut history, it will probably be hard to give the 1997 capital gains tax cut much of the credit for whatever increase in capital gains realizations did occur in 1997. In fact, CBO now predicts that reported capital gains rose about the same amount in 1997 that they did in 1996 (but does not expect that jump to be sustained in 1998 and later years.)
Recently, House Speaker Newt Gingrich told reporters that the Joint Committee on Taxation has almost doubled its estimate of the amount of capital gains realized in tax year 1997, and has attempted to give the credit for that change to the 1997 capital gains tax cut. But Gingrich’s contention is false. What really happened is that the Joint Committee sharply revised its capital gains baseline for 1997 in light of new data from the IRS showing a 40% jump in capital gains in 1996.
In other words, Gingrich is trying to give the 1997 tax act credit for the surge in capital gains that took effect in 1996, the year before it was enacted. To be sure, Gingrich recognizes that this is a hard case to make. But Gingrich is reportedly relying on a novel theory put forward by former Reagan economic adviser Larry Kudlow to contend that the 40% surge in capital gains realizations in 1996 reflects investors’ mistaken expectation that Congress would pass a large, retroactive capital gains tax cut sometime late in 1996.
Let’s recall a little history. On November 30, 1995, not long before the government shutdown, Congress did indeed send a major capital gains tax cut to the President (as part of its budget reconciliation bill). The measure was quickly vetoed by President Clinton. That was the end of any serious consideration of a capital gains tax cut until the 1997 budget agreement.
So, there was no basis for investors to believe in 1996 that there was any chance that a retroactive capital gains tax cut could pass Congress and be signed by the President.
Conclusion: So here’s what we know at this point:
- The anticipated surplus in 1998 stems from both higher revenues and reduced spending.
- Almost two-thirds of the revenue hike so far in fiscal 1998 has come from increased taxes withheld on wages (largely reflecting the low unemployment rate).
- The surge in capital gains realizations began long before the 1997 capital gains tax cut took effect, and appears to have mainly reflected the strong growth in the stock market. As a result, further capital gains tax cuts are extremely unlikely to increase tax revenue; on the contrary, such tax cuts will probably prove to be very costly.
|
| Fiscal Year |
Growth in Tax Revenues from Previous Fiscal Year |
Growth in Spending from Previous Fiscal Year |
| 1990 |
+3.7% |
+9.6% |
| 1991 |
+2.7% |
+5.7% |
| 1992 |
+2.9% |
+4.2% |
| 1993 |
+6.6% |
+1.9% |
| 1994 |
+8.8% |
+3.6% |
| 1995 |
+6.9% |
+3.4% |
| 1996 |
+7.7% |
+2.7% |
| 1997 |
+8.8% |
+2.5% |
| 1998e |
+7.5% |
+3.9% |
| 1999e |
+3.9% |
+3.8% |
| 2000e |
+2.6% |
+2.5% |
| 93-98 ave |
+7.7% |
+3.0% |
|
 Sources for all data and estimates: Internal Revenue Service for calendar year tax data through tax year 1996 (the latest available). Office of Management and Budget for tax and spending data for fiscal years through 1997. Treasury Department “Monthly Budget Statements” for tax revenues and spending by month in fiscal 1998 through May. Office of Management and Budget (May 1998) and Congressional Budget Office (June 1998) for revenue and spending estimates beyond May of 1998.


