April 1, 2013 05:57 PM | Permalink | 
Read this report in PDF.
(See the accompanying two-sided fact sheet)
Click on Charts to See High Quality Version.
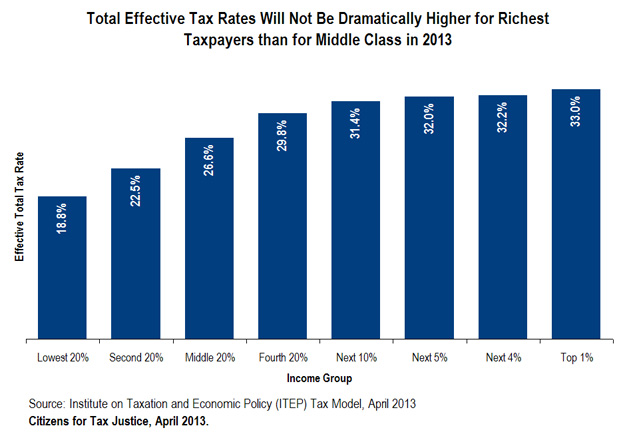
The deal approved by Congress on New Years Day to address the “fiscal cliff” does not require the richest Americans to pay a disproportionate share of taxes, despite common claims that it does. As the graph and table below illustrate, the deal resulted in a tax system that is modestly more progressive than the one we would have if Congress had simply extended all of the tax laws in effect in 2012.
Taxes have gone up slightly for all income groups because of the expiration of the payroll tax holiday (which was quietly accepted by most lawmakers of both political parties), as well as the expiration of some Bush-era tax cuts for the rich and a previously enacted health-care-related tax on the rich that took effect this year.
The graph and table that follow compare the taxes that Americans in different income groups will or would pay in 2013 under two scenarios. The first reflects the laws now in effect. The second is what Americans would be paying if all of the Bush-era tax cuts had been extended, the 2012 payroll tax cut had also been extended, and the increase in the Medicare Hospital Insurance (HI) on high-income people had not gone into effect.
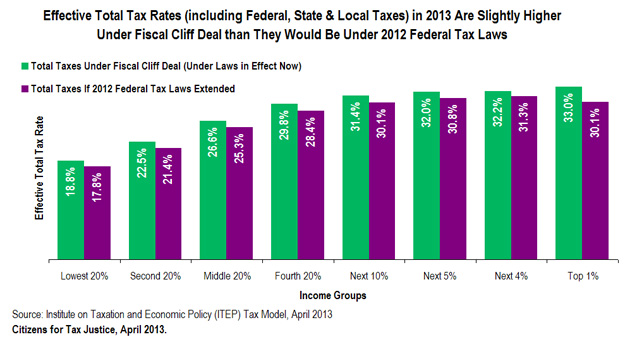
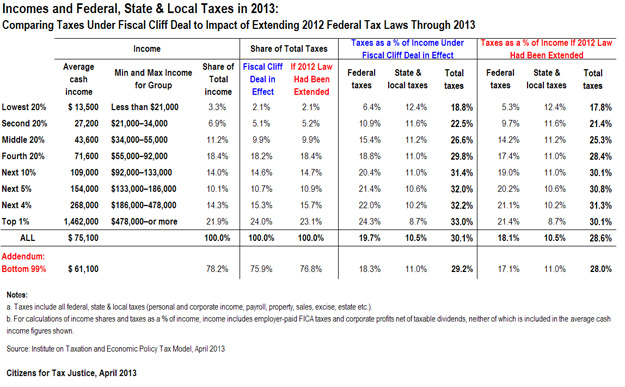
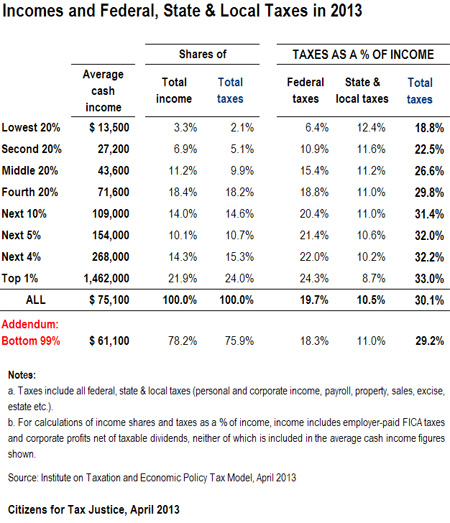
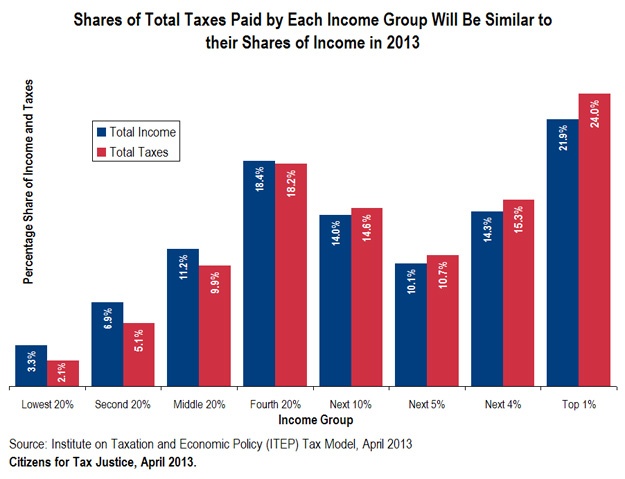
As the table above illustrates, the richest one percent of Americans will receive 21.9 percent of the total income in the U.S. in 2013. Under the tax rules in effect this year, they will pay 24 percent of the total federal, state and local taxes. If Congress had extended all of the tax rules that had been in effect in 2012, then the richest one percent of Americans would pay 23.1 percent of the total taxes this year. In either scenario, the share of taxes paid by the richest one percent is slightly (but not dramatically) larger than the share of total income received by this group.
In other words, the richest one percent of Americans are not paying a disproportionate share of taxes, and the tax changes that took effect this year did not make a dramatic difference.
Taxes that Have Changed in 2013
The taxes that have gone up in 2013 (but which would not have gone up if Congress had extended all 2012 federal tax laws) include the following:
■ Personal income tax rates and limits on exemptions and deductions.
Under the fiscal cliff deal, two parts of the personal income tax cuts originally enacted under President George W. Bush were allowed to partially expire for the rich. The first is the reduction in the top income tax rate from 39.6 percent to 35 percent. The rate was allowed to revert back to 39.6 percent for married couples with taxable income greater than $450,000 and singles with taxable income greater than $400,000. The second is the personal exemption phase-out and the limitation on itemized deductions (often called “PEP and Pease”) which were allowed to come back into effect for married couples with adjusted gross income (AGI) greater than $300,000 and singles with AGI greater than $250,000.
■ Hospital Insurance (HI) taxes on income of the wealthy.
Two increases in the Medicare Hospital Insurance (HI) tax were enacted as part of President Obama’s major health care reform law, and the fiscal cliff deal did nothing to prevent them from taking effect in 2013 as scheduled.
Before 2013, the HI tax was a 2.9 percent tax on earnings. (Technically employed people directly pay half the tax while their employer directly pays the other half, but economists agree that the worker ultimately bears even the latter half of the tax in the form of reduced wages and benefits.)
One increase in the HI tax is the introduction of a higher rate (3.8 percent) for earnings above $250,000 for a married couple and above $200,000 for a single person (in other words, an additional 0.9 percent tax on earnings above these levels). The other increase allows the HI tax to apply to most types of investment income (which had been exempt from the HI tax until now) besides retirement income. This part of the tax is a 3.8 percent tax on investment income to the extent that it makes up a taxpayer’s AGI in excess of $250,000 for a married couple or $200,000 for a single person.
■ Social Security payroll taxes.
The Social Security payroll tax is normally 12.4 percent of earnings, up to a cap that is adjusted for wage growth each year. (This year the tax applies to a worker’s earnings up to $113,700.) Half the tax is paid directly by employees while the other half is paid directly by employers. (Again, economists agree that even the latter half of the tax is ultimately borne by employees.) The tax takes up a larger percentage of income for the typical low- or middle-income worker than it does for a high-income person because of the wage cap and also because high-income people are more likely to receive a portion of their income in the form of investment income, which is not subject to this tax.
In 2012, a payroll tax “holiday” was in effect which reduced the Social Security tax to 10.4 percent. (Technically, the part of the tax paid directly by employees was reduced from 6.2 percent to 4.2 percent.) The fiscal cliff deal did not extend the payroll tax holiday, meaning the tax rate reverted to 12.4 percent in 2013.
Why Have Some Observers and News Reports Claimed that the Poor Pay Little or Nothing While the Rich Pay a Disproportionate Share of Taxes?
Some political commentators and some major media outlets have reported that low- and middle-income Americans pay little or no taxes while the rich pay a hugely disproportionate share of taxes, and that this is especially the case in 2013 as a result of the fiscal cliff deal.
Sometimes this misconception occurs because people erroneously focus only on the federal personal income tax, which is the most progressive major tax we have. In other instances, thoughtful people do look at all of the federal taxes Americans pay, but ignore state and local taxes and measure income in a way that is incomplete. The next two sections address each of these sources of confusion.
The Federal Personal Income Tax Is Progressive, But Most Other Taxes that Americans Pay Are Regressive
In April 2009, estimates released by the Urban-Brookings Tax Policy Center (TPC) created a tsunami of misunderstanding that raged for years and finally crested during the presidential campaign of Mitt Romney in 2012. The figures released by TPC in 2009 showed that nearly 43.4 percent of Americans would have “zero or negative tax liability” that year.[1]
Close examination of the table containing the figures made clear that TPC had estimated 43.4 percent of Americans would not pay federal personal income taxes that year. It was certainly not saying that this group would not pay other federal taxes or state and local taxes.
But that was largely lost in the months that followed. A news article about the figures quoted a TPC senior fellow saying, “You’ve got a larger and larger share of people paying less and less for the services provided by the federal government. The concern is that the majority can say, ‘Let’s have more benefits, spend more,’ if they’re not paying for it. It’s ‘free.’ That’s not a good thing to have.”[2]
A TPC update in June of that year increased its estimate to 46.9 percent — nearly 47 percent of Americans.[3]
Flash forward to the presidential campaign trail in 2012, where Mitt Romney famously told a room full of donors, during what he believed to be an off-record event,
“There are 47 percent of the people who will vote for the president no matter what. All right, there are 47 percent who are with him, who are dependent upon government, who believe that they are victims, who believe the government has a responsibility to care for them, who believe that they are entitled to health care, to food, to housing, to you-name-it… These are people who pay no income tax.”[4]
For several years, Citizens for Tax Justice has estimated the total federal, state and local taxes paid by Americans in each income group. We’ve found that no one group is getting a free-ride and that the tax system overall is just barely progressive. For example, the table above shows that the poorest fifth of Americans (the “lowest 20%”) will pay 2.1 percent of the total (federal, state and local) taxes in America in 2013. The table also shows that this same group will only receive 3.3 percent of the total income in the country this year. So the poorest fifth of Americans do pay a share of taxes that is lower than their share of total income, but not dramatically lower.
Likewise, the richest one percent of Americans in 2013 will pay 24 percent of total taxes and receive 21.9 percent of total income. In other words, the share of taxes paid by the richest Americans is slightly greater than their share of total income, but not dramatically so.
The table also shows that the tax changes that took effect this year did not dramatically alter this distribution of America’s taxes.
Incomplete Measures of Income Result in Incomplete Measures of Distribution of Taxes
There is no comprehensive source for estimates of state and local taxes other than those generated by CTJ’s partner organization, the Institute on Taxation and Economic Policy (ITEP). The figures in this report and the accompanying fact sheet, which incorporate state and local tax estimates from ITEP, are therefore the only real estimates of the total taxes paid in America.
Some analysts do at least estimate total federal taxes. However, when these analysts estimate effective federal tax rates for all federal taxes, they typically come up with figures that are different from ITEP’s estimates of effective federal tax rates. This is often because these analysts are estimating income in a way that is less comprehensive than the method used by ITEP.
An incomplete estimate of income affects the calculation of effective tax rates, which are taxes divided by income. For example, imagine that two economists agree that a group of people paid $500,000 in taxes one year, but disagree about the amount of income this group received during the year. One economist believes the group of people received $1 million in income and therefore had an effective tax rate of 50 percent. The other economist believes the group of people received income of $2 million and therefore had an effective tax rate of 25 percent.
Disagreements about measuring income in America today are not as dramatic as in this example, but they nonetheless lead to different estimates of effective federal tax rates.
Specifically, some analysts assume that the income reported by high-income taxpayers to the IRS is essentially equal to all of the income that these taxpayers have. However, many kinds of income are not included in federal adjusted gross income, but are nonetheless real income.
In estimating taxpayers’ income, ITEP begins with the adjusted gross income (AGI) reported by taxpayers to the IRS and then adds sources of income that are not included in AGI. For the bottom three-fifths of Americans this additional income primarily reflects untaxed transfers, most notably non-taxable Social Security benefits. In the top income group (the top one percent), the additional income primarily reflects ITEP’s conservative estimates of unreported and unrealized capital gains and understated business income.
For the income groups in between, additional income includes the above items, but the difference is much smaller than it is in the lower and top income groups, because wages subject to withholding dominate the total income of taxpayers in these in-between groups.
As a result of these adjustments, the income concept ITEP uses to separate taxpayers into income groups and to calculate effective tax rates is bigger than the income reported on tax returns. By our measure of income, in the bottom three quintiles, 75 percent of total income is reported as part of AGI on tax returns. In the top income group, 78 percent of total income is reported as AGI on tax returns. In the in-between groups, 91 percent of total income is reported as AGI on tax returns. The overall average is 85 percent.
This definition of income is one that most people understand. For example, Social Security recipients know that they receive Social Security benefits even if some or all of those benefits are not taxable. Likewise, high-income investors know that the capital gains they report on their tax returns are generally considerably less than the capital gains they actually enjoy. This means that people can look at ITEP’s estimates for different income groups and easily identify which income group they fall into.
One final note: Effective tax rates are calculated as taxes divided by income. The income definition that ITEP uses to calculate effective tax rates when all taxes are included in the analysis is the definition of income just described, plus two adjustments to account for sources of income recognized by all economists (even if not entirely understood by most people trying to determine which income group they belong to).
First, in computing effective Social Security and Medicare tax rates we (like virtually all analysts) count both the employee and employer shares of these taxes. But that logically requires including the employer share of the taxes in income (as well as in taxes) in calculating effective tax rates.[5] Second, since we include corporate income taxes, attributed to investors, in our total tax calculations, we also include in income, for purposes of calculating effective tax rates, pretax corporate profits (of non-pass-through corporations), net of taxable dividends paid to individual shareholders.[6] These two adjustments increase the total income used for calculating effective tax rates by an average of 14 percent.
[1] Tax Policy Center, Table T09-0202: Tax Unites with Zero or Negative Tax Liability, 2009-2019, April 14, 2009. http://www.taxpolicycenter.org/numbers/displayatab.cfm?Docid=2276&DocTypeID=7
[2] Declan McCullagh, “The Income Tax System is Broken,” CBS News, April 15, 2009. http://www.cbsnews.com/2100-503363_162-4945874.html
[3] Tax Policy Center: Table T09-0334: Distribution of Tax Units with Zero or Negative Individual Income Tax Liability by Cash Income Level, June 19, 2009. http://www.taxpolicycenter.org/numbers/displayatab.cfm?Docid=2409
[4] David Corn, “SECRET VIDEO: Romney Tells Millionaire Donors What He REALLY Thinks of Obama Voters,” Mother Jones, September 17, 2012. http://www.motherjones.com/politics/2012/09/secret-video-romney-private-fundraiser
[5] Economists generally agree that the part of the payroll tax that is paid directly by employers is a portion of the employee’s income that would have been paid to the employee (in the form of higher wages or benefits) but is instead paid to the federal government as taxes.
[6] Some analysts do not attribute pretax corporate profits to investors, even though they do count corporate income taxes as ultimately paid by investors in computing effective tax rates. These analysts assume that all corporate profits eventually show up in individuals’ incomes, either as taxable dividends (which we do subtract from pretax corporate profits) or taxable capital gains. We believe that this assumption is unwarranted. since most individual capital gains show up either in retirement benefits, on which the effective individual tax rate is zero or less or are never realized or reported (in part due to the rule that exempts capital gains on inherited assets from tax forever). Contributions to retirement funds (pensions, 401k’s, etc.) are not taxable as earnings when the contributions are made, thus avoiding both income and payroll taxes. Distributions during retirement are taxable. But, assuming a constant tax rate, this is the mathematical equivalent of taxing the contributions when made and exempting the distributions from tax. (This is why analysts treat tax-deductible IRA contributions as the equivalent of “Roth IRAs,” where the contributions are not deductible, but the distributions are tax-exempt.) In fact, since tax rates on retirement distributions from pensions, 401k’s, etc. are likely to be taxed at a lower tax rate than the tax rate avoided by the tax exemption for contributions, the actual tax rate on retirement income is likely to be negative.
 ust in time for Tax Day 2013, our quarterly newsletter Just Taxes is arriving in mailboxes this week. This edition features original articles discussing the fallacies of anti-tax legislation in state legislatures, Facebook’s tax avoidance schemes, the release of ITEP’s new report, Who Pays? and highlights of ITEP and CTJ’s recent press coverage. Starting this year, we are putting back issues of Just Taxes online, and you can now browse editions from the past nine years.
  expenditures limited under the proposal.
  Are economically disadvantaged families in the US likely to reverse their fortunes anytime soon? Not according to