Analysis of McCain Tax Proposal

January 11, 2000 01:00 PM | | Bookmark and Share

Click here to see this analysis in PDF format.


Related CTJ Publications:

The tax plan announced on Jan. 11 by Sen. John McCain would provide little or no benefit to the three-fifths of taxpayers who earn less than $39,000 a year; it also offers little to the one percent of taxpayers who make more than $319,000. Instead:

  • More than half of McCain’s proposed tax cuts would go to taxpayers making between $65,000 and $130,000 a year, a group that includes 15% of all taxpayers.
  • Most of the rest of McCain’s tax cuts would be divided between the 20 percent of taxpayers making between $39,000 and $65,000 (who get 21% of the cuts) and the 4 percent of taxpayers making from $130,000 to $319,000 (who get 19%).
  • Overall, the McCain plan would cut taxes by about $500 billion over ten years.

These are the results of an analysis of the McCain tax plan using the Institute on Taxation and Economic Policy’s Tax Model, and released by Citizens for Tax Justice.

Starting point for 28% tax bracket would be increased

The centerpiece of McCain’s tax cut plan would substantially raise the starting points for the 28% income tax bracket. Overall, McCain’s plan would move almost 17 million taxpayers out of the 28% bracket, cutting their top marginal income tax rate to 15%.

  • The McCain plan would increase the percentage of taxpayers in the 15% income tax bracket or below from 74.2 percent under current law to 87.4 percent.
  • Put another way, the number of taxpayers in income tax brackets higher than 15% would be cut in half, from 25.8 percent of all taxpayers to 12.6 percent.
  • Of course, by definition, raising the starting point for the 28% tax bracket offers no benefit to the three-quarters of taxpayers who are already in a lower bracket under current law.

Corporate loopholes targeted

The other key element of McCain’s tax plan is a proposal to pay for a large portion of the tax cuts with an array of corporate loophole-closing provisions, which McCain estimates would raise $151.7 billion over five years.

Comparison to George W. Bush’s tax plan

Neither the McCain tax plan nor Gov. George W. Bush’s competing, $1.7 trillion (over ten years) tax cut plan would provide much benefit to the bottom three-fifths of taxpayers. Bush assigns about 11 percent of his tax cuts to this large group of taxpayers; McCain, only about 5 percent.

Besides their huge disparity in overall size, perhaps the sharpest difference between the two plans is what they offer to people at the very top of the income scale.

  • Bush’s plan targets 36.9 percent of its tax cuts to the top one percent of all taxpayers, offering them an average tax reduction of more than $50,000 each.
  • In contrast, McCain’s plan gives only 1.8 percent of its net tax cuts to the best-off one percent. (For more details on the Bush tax plan, click here.)

mccain v. bush comparison chart

Details of the McCain tax plan:

1. Over five years, the starting points for the 28% tax bracket would be increased, from the current $43,050 in taxable income to $70,000 for couples, from $34,550 to $52,000 for single parents, and from $25,750 to $35,000 for singles without children. Note that the dollar figures refer to taxable income, so that, for example, families of four would get no benefit until their total income exceeds about $65,000 (in 1999 dollars). The full benefit would not be realized until income approaches $100,000. Because the new starting point for the 28% bracket for couples would be double the single level (although not twice the level for single parents), the change would reduce “marriage penalties” for many couples.

2. The $500 per child tax credit would be increased to $750 per child in 2001 and to $1,000 per child in 2002 and thereafter.

3. The estate tax exemption would be increased from the current $1 million to $5 million (effectively $10 million for couples), phased in over ten years.

4. Over five years, the standard deduction for couples would be increased by 19% (to twice the single amount) and for single parents by 16%. These changes would provide tax relief to many filers who take the standard deduction, as well as to some itemizers. (About 2 million current itemizers would switch to the increased standard deductions.)

5. Up to $200 ($400 for couples) in interest and dividends would be tax-exempt.

6. Limits for 401(k) plan contributions would be increased to $15,000 a year, and similar changes would be made to certain other kinds of retirement savings plans.

7. “Medical Savings Accounts” would no longer be limited to 750,000 taxpayers; the annual contribution limit on “Education Savings Accounts” would be doubled to $1,000; and new tax-deferred “Family Savings Accounts” would be provided for bottom-bracket taxpayers (few of who could afford to take advantage of them).

8. Long-term care insurance premiums would be made deductible.

9. Military personnel overseas would be exempt from tax on some or all of their earnings.

10. A 100% tax credit would be provided for gifts to public and private elementary and secondary schools, up to $200 a year. If all eligible taxpayers took advantage of this free opportunity to help their local schools, this provision could cost more than $17 billion a year (in 1999 dollars). Sen. McCain’s estimate of the size of his tax cuts does not appear to reflect the large potential cost of this school-aid program, which could be implemented more straightforwardly and with better targeting through direct grants to schools. (The distribution tables that follow do not include this credit, which appears to be intended as a backdoor way to funnel money to schools, rather than as a tax relief program.)

11. To offset much of the cost of his tax cuts, Sen. McCain proposes to curtail numerous corporate tax breaks, totaling $151.7 billion over five years. Sen. McCain provides an illustrative list, but does not specify the exact loopholes he would close.


    Want even more CTJ? Check us out on Twitter, Facebook, RSS, and Youtube!

In Defense of the 1986 Tax Reform Act

January 7, 2000 02:35 PM | | Bookmark and Share

Click here to see this analysis in PDF format.


Lately, some very misinformed people have been mistakenly criticizing Bill Bradley’s tax record, in particular his major role in the enactment of the Tax Reform Act of 1986. Citizens for Tax Justice doesn’t take sides in political debates– commendably, Vice President Gore also supported the legislation–but we want to set the record straight about the 1986 Tax Reform Act.

The 1986 Tax Reform Act is widely considered to be the best piece of American tax legislation since the adoption of the income tax. Over its first five years, it closed more than $500 billion in loopholes and tax shelters. As a result:

Effects of the Tax Reform Act of 1986
(1996 Income Levels)
Income
Group ($-000)
% of
Taxpayers
Average
Tax Change
Change as
% of Income
Below $10 18.6% $ –15 –0.3%
$10-20 21.5% –135 –0.9%
$20-30 15.8% –230 –0.9%
$30-40 11.5% –215 –0.6%
$40-50 8.7% –205 –0.5%
$50-75 13.2% –380 –0.6%
$75-100 5.2% +155 +0.2%
$100-200 3.9% +895 +0.7%
$200+ 1.2% +9,360 +1.8%
  • Major U.S. corporations that previously had paid little or nothing in income taxes due to loopholes were put back on the tax rolls, and corporate taxes were increased overall by a net of more $100 billion over five years.
  • A huge wasteful tax-shelter industry for high-income individuals was shut down.
  • Tax rates on capital gains income were set at the same level as on other income.
  • Millions of moderate-income working families got tax relief through a major expansion of the earned-income tax credit.
  • Taxes on most families (on average, all but the best-off tenth) were reduced. (The table shows the tax changes by income group.)
  • The income tax was substantially simplified for most filers.

Allied in support of the 1986 reforms were a vast array of public interest groups, labor unions and citizens groups around the country. The act was also highly praised by most economists, because it leveled the playing field for businesses and investments, and made our economy more efficient and productive.

Unsuccessfully opposing the 1986 Tax Reform Act were low- and no-tax corporations, recalcitrant supply-siders and tax-shelter promoters. (Opponents included, for example, Newt Gingrich, Bill Archer and billionaire Donald Trump, who continues to criticize the act for cracking down on abusive real-estate tax shelters.)

“The 1986 Tax Reform Act wasn’t perfect, but it was unquestionably a huge victory for tax fairness and economic common sense,” said CTJ director Robert S. McIntyre. “Anyone who states or implies otherwise is misinformed.”


    Want even more CTJ? Check us out on Twitter, Facebook, RSS, and Youtube!

Income Taxes on Working Families with Modest Incomes Under the George W. Bush Tax Plan

January 1, 2000 01:01 PM | | Bookmark and Share

Click here to see this analysis in PDF format.


Introduction & summary:

The current federal income tax system does not tax the earnings of low- and moderate-income working families with children. In fact, the vast majority of such families actually enjoy “negative” income taxes. In other words, their earnings are higher after income taxes than before income taxes. For example, a single mother with one child earning

Current Income Taxes on Working Families
Who Get the Earned-Income Tax Credit
Income Group % of EITC Families Average Income Tax Now
Less than $10,000 16.8% $ –1,829
$10-20,000 41.9% –2,343
$20-30,000 34.5% –1,002
$30,000+ 7.7% –497
All EITC families 100.0% $ –1,658

$18,000 a year in wages before taxes makes $19,004 after federal income taxes.

Of fiscal necessity, the income tax rebates enjoyed by low- and moderate-income working families are phased out above certain income levels. An unfortunate side effect is that some working families can face quite high “marginal” income tax rates over the phase-out range, even though their actual income taxes paid remain very low or negative. To illustrate:

  • As noted above, a single mother with one child earning $18,000 enjoys a federal income tax rebate of $1,004. But if she earns an additional $100, her income tax rebate falls by $31, to $973–a marginal income tax rate on that $100 of 31%.
  • Likewise, a single mother with two children earning $22,000 gets a federal income tax rebate of $1,701. But if she earns an additional $100, her rebate falls by $36, to $1,665, a marginal income tax rate on that $100 of 36%.

These high “marginal” income tax rates worry some tax analysts.(1) In theory, a high marginal tax rate can discourage work effort in some cases by reducing the rewards for working versus goofing off. Of course, in theory a high marginal tax rate can also encourage more work effort in some cases, since it takes more work to make enough money to support one’s family. In any event, here is an example of how high marginal tax rates can coexist with very low average tax rates under current law:

  • A single mother with one child with a wage of $9 an hour will earn $18,000 a year before taxes at a full-time job. After federal income taxes, her hourly wage will average $9.50 an hour. So her average federal income tax rate is -5.6%. If she works an additional 11 hours at $9 an hour (earning $100 more in gross pay), her federal income tax rebate will fall by $31. That means an after-tax hourly rate of only $6.21 an hour on the additional $100 in earnings (before payroll taxes and state and local taxes). This is true even though the mother’s total pay after federal income taxes of $19,073 is still higher than her pretax pay of $18,100 (and her average federal income tax rate is -5.4%).

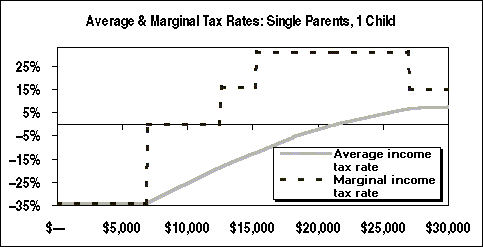
The following table and chart offer more illustrations of average and marginal tax rates on low- and moderate income single parents with one child under current law.


Chart: Average and Marginal Tax Rates: Single Parents, 1 Child

George W. Bush’s tax plan and working families: To justify the large federal tax cut he proposed in December 1999, Gov. George W. Bush emphasizes the positive effects that his plan will have in reducing marginal tax rates on low- and moderate-income working families:

“[B]ecause the benefit of the Earned Income Credit diminishes as a worker’s income increases, a single mother with two children on the outskirts of poverty will lose half of any additional dollar she earns (taking into account social insurance taxes and state income taxes). The benefit of taking an extra training course or working an extra shift is cut in half by the government. . . . Lowering these barriers to the middle class is one of Governor Bush’s top priorities.”(2)

There is no doubt that the Bush tax plan would reduce marginal tax rates on some working families with children. Whether this can be considered one of the “top priorities” of the Bush tax plan is another question, however.

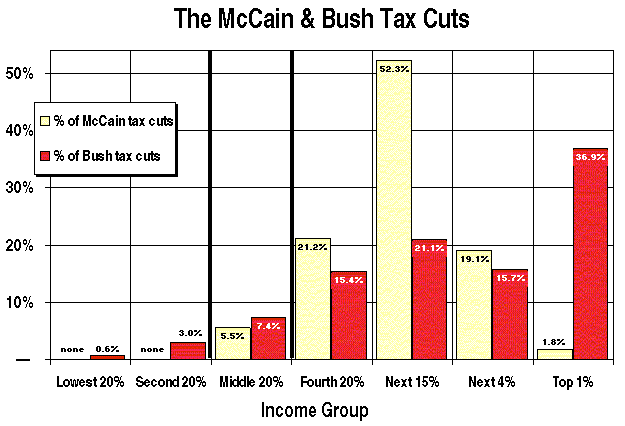
As is explained in more detail below, the Bush proposal would reduce marginal tax rates for about a fifth of the 13.9 million working families with children that now get the earned-income tax credit. These changes will help those families, but their effects should not be overstated. Bush’s proposed tax cuts for working families with children who get the earned income tax credit total $2.6 billion a year (at 1999 levels). That equals only one percent of these families’ incomes, and averages only $182 per family.

Put another way, the $2.6 billion in total tax cuts that Bush proposes for moderate-income working families with children is only 1½ percent of the total annual reduction in taxes that Bush proposes. In contrast, 62 percent of Bush’s proposed tax cuts–a total of $105 billion a year–is targeted to the best off 12.7 million taxpayers.(3)

Detailed Analysis

Current Income Taxes on Moderate-Income Working Families

Under current law, federal income taxes on low- and moderate-income working families with children are very low. In fact, the vast majority of low- and moderate-income working families with children actually enjoy “negative” income taxes. For example,

  • A couple with two children does not have a positive income tax until earnings exceed $28,215. A single parent with two children does not pay income tax until earnings exceed $26,720.
  • A couple with one child does not have a positive income tax until earnings exceed $22,985. A single parent with one child does not pay income tax until earnings exceed $21,245.

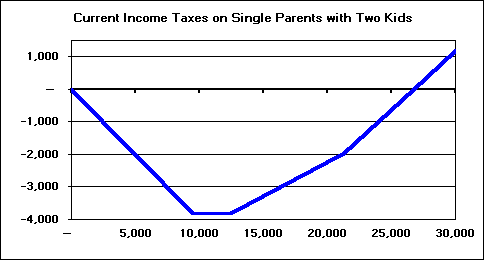
Below these income levels, low- and moderate-income working families receive actual tax rebates, due to the refundable earned income tax credit. For example, couples and single parents with two children earning $20,000 get a tax rebate (a negative income tax) of $2,232. Overall, the average federal income tax rebate for working families with children earning less than $27,500 a year is $1,755. Most of the families receiving these rebates (two-thirds) are headed by single parents.

Chart: Current Income Taxes on Single Parents with Two Kids


Marginal Tax Rate Issues:

Although actual income taxes are negative for most moderate-income working families, “marginal” income tax rates–the amount of tax paid or tax rebate lost on additional earnings–can occasionally be quite high. Marginal income tax rates can reach 36 percent for some moderate-income families with two children (and in rare cases for families with three or more children), and climb as high as 31 percent for some one-child families.

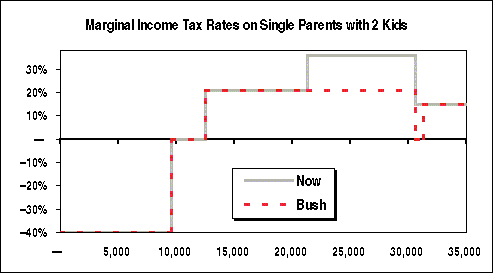
  • For single parents with two children, the 36 percent marginal income tax rate applies to earnings between $21,267 and $30,600. For couples with two children, the range for the 36 percent rate is between $24,867 and $30,600.
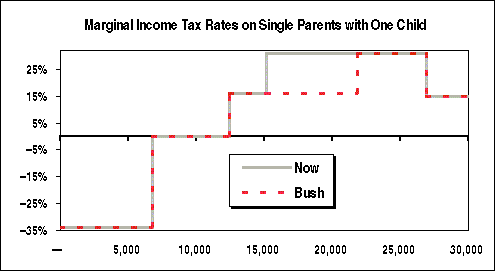
  • For single parents with one child, the 31 percent marginal income tax rate applies to earnings between $15,183 and $26,930. For couples with one child, the 31 percent range is between $18,785 and $26,930.

These high marginal income tax rates stem primarily from the phase-out rules for the earned-income tax credit. The EITC is a refundable tax credit worth as much as $3,820 to families with two or more children and up to $2,312 for families with one child. The credit is phased out, however, above $12,460 in earnings. Specifically:

  • The EITC is reduced by 21 cents for each dollar of additional earnings between $12,460 and $30,600 for families with two or more children.
  • The EITC is reduced by 16 cents for each dollar of additional earnings between $12,460 and $27,930 for families with one child.

The rest of the high marginal income tax rates on some moderate-income working families stems from the 15 percent tax bracket. The starting points for the 15 percent bracket vary by family size and type. For instance:

  • For single parents with two children, the 15 percent bracket begins at $21,267 in earnings. For couples with two children, it starts at $24,867.
  • For single parents with one child, the 15 percent bracket begins at $15,183. For couples with one child, it starts at $18,785.

As noted, however, despite the high “marginal tax rates,” actual income tax liabilities for moderate-income working families with children are very low, in fact, generally negative. But some analysts worry about the possible disincentive effects of the high marginal income tax rates that some of these families face. Indeed, counting Social Security and Medicare payroll taxes, the marginal rate on increased earnings can exceed 50 percent in some cases (counting both the employer and employee shares of the 15.3 percent total payroll tax).

The Bush Tax Plan

In part to try to address the potential disincentive effects of these high marginal tax rates on moderate-income working families, the Bush tax plan offers two proposals:

  • A new 10 percent tax bracket for the first $12,000 in taxable income for couples and $10,000 in taxable income for single parents.
  • Doubling of the per-child tax credit for children under 17, from $500 to $1,000.

These two changes(4) would cut marginal tax rates on some EITC families by reducing or eliminating the ranges of income in which the 15 percent tax bracket overlaps with the 16 percent or 21 percent phase-out rates for the earned income tax credit. (The EITC phase-out rates and ranges themselves would be unaffected.)

As a result, the current 36 percent marginal tax rate that some two-child moderate-income working families face would be eliminated. Those families now in the 36 percent marginal rate would see their marginal rate drop to 21 percent (just the EITC phase-out rate). In addition, the range of income now subject to the 31 percent rate (some one-child families) would be substantially narrowed. Specifically:

  • The 36 percent marginal tax rate faced by two-child couples making between $24,867 and $30,600 and by two-child single parents making between $21,267 and $30,600 would drop to 21 percent.
  • For single parents with one child, the range of income subject to the 31 percent marginal tax rate, which is now from $15,183 to $26,930, would be narrowed to a range of $21,850 to $26,930.
Marginal Tax Rate Reductions for EITC Families Under the Bush Tax Plan
  Married Couples Single Parents
  1 Kid 2 Kids 1 Kid 2 Kids 3 Kids
EITC Phase-Out: 16.0% 21.1% 16.0% 21.1% 21.1%
Starts $ 12,460 $ 12,460 $ 12,460 $ 12,460 $ 12,460
Ends 26,930 30,600 26,930 30,600 30,600
Income Tax before EITC Starts
Current law rate of 15% 15% 15% 15% 15%
Starts at 18,785 24,867 15,183 21,267 24,130
Bush plan rate of 10% 15% 15% 15% 15%
Starts at 25,450 35,533 21,850 31,267 40,683
Overlaps:
Current law: From: $ 18,785 $ 24,867 $ 15,183 $ 21,267 $ 24,130
To: 26,930 30,600 26,930 30,600 30,600
Width of Range: 8,145 5,733 11,747 9,333 6,470
Bush plan: From $ 25,450 no $ 21,850 no $ 27,567
To: 26,930 overlap 26,930 overlap 30,600
Width of Range: 1,480 none 5,080 none 3,033
Dollar Change in Overlap Range under Bush: $ –6,665 $ –5,733 $ –6,667 $ –9,333 $ –3,437
% of all EITC families of each type with marginal rate cuts under Bush (20.6% of all EITC families) 32.2% 17.9% 23.3% 23.3% 8.3%
Note: income tax rates above the end of the EITC phase-out range are not shown.

For single parents with one child, the range of income subject to the 31 percent marginal tax rate, which is now from $15,183 to $26,930, would be narrowed to a range of $21,850 to $26,930.

  • For one-child married couples, the 31 percent marginal rate that now applies between $18,785 and $26,930 would be eliminated. The marginal tax rates on this range of income under the Bush plan would be 16 percent on earnings between $18,785 and $25,500 and 26 percent on earnings between $25,500 and $26,930.

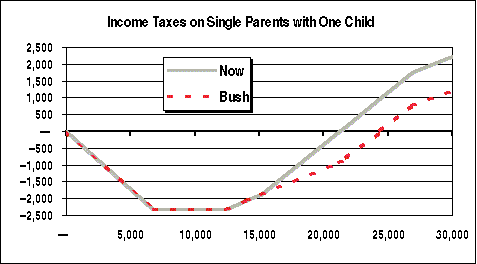
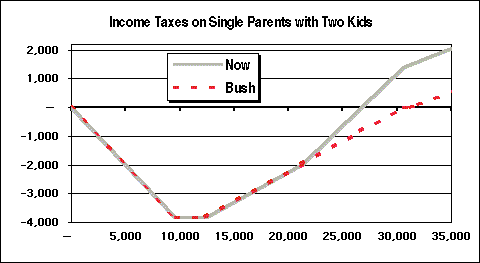
The charts that follow illustrate the effects of the Bush proposals on marginal rates faced by moderate-income single parents.

Chart: Marginal Tax Rates on Single Parents with Two Kids

Chart: Marginal Tax Rates on Single Parents with One Child

Changes in actual income taxes under the Bush plan: The reductions in marginal tax rates proposed by Bush would also increase tax rebates (or reduce taxes paid) for some moderate-income working families with children. The following charts illustrate those effects on single parents:(5)

Chart: income Taxes on Single Parents with One Child

Chart: Income Taxes on Single Parents with Two Kids

The Bush Bottom Line: Overall, the Bush proposal would reduce marginal tax rates for

Effects of All Bush Tax Cuts on All
Families With Children Who Get the EITC
Income Group Millions of
EITC
Families
% of all
EITC
families
Average
Bush
Tax Cut
Less than $10,000 2.3 16.8% $ —
$10-20,000 5.8 41.9% –47
$20-30,000 4.8 34.5% –355
$30,000+ 1.1 7.7% –539
All EITC families 13.9 100.0% $ –182
Bush tax cuts (annual at 1999 levels)
Total amount $ –172.1 billion
Amount to EITC families –2.6 billion
Share to EITC families 1.5%
Figures include effects of:
new 10% tax bracket; doubling the per child tax credit to $1,000;
a deduction for two-earned couples;
and an above-the-line charitable deduction for non-itemizers.
Income classifier includes income that is not part of AGI.

about 2.9 million of the 13.9 million working families with children that now get the earned-income tax credit. Another 2.6 million EITC families would get tax reductions or larger tax rebates under the Bush plan, although their marginal tax rates would not be affected.

These changes will be helpful to the affected families, but their effects should not be overstated. The sum total of all of Bush’s proposed tax cuts on working families with children who get the earned income tax credit is $2.6 billion a year (at 1999 levels),(6) equal to only one percent of these families’ incomes, and averaging only $182 per family.

Put another way, that $2.6 billion in total tax cuts for moderate-income working families with children is only 1.5% of the total annual reduction in taxes that Bush has proposed. That compares to 62 percent of Bush’s tax cuts–$105 billion a year–that is targeted to the best off 12.7 million taxpayers.


    Want even more CTJ? Check us out on Twitter, Facebook, RSS, and Youtube!

GOP Hopes Big Wave of Capital Gains Tax Prepayments Will Offset 95 Percent of Tax Plan’s Cost in FY 2001

August 13, 1999 05:36 PM | | Bookmark and Share

The official congressional estimates of the cost of the GOP’s proposed capital gains tax cut show an unusual blip in fiscal 2001, when the capital gains tax cut is supposed to boost federal revenues by a net $15.5 billion. Likewise, the Joint Committee on Taxation’s distributional table showing its controversial estimates of the effects of certain of the tax cuts in calendar 2000 claims that the overall tax cut bill will be a net tax increase of $16.4 billion in that year.

  • After accounting for the small non-capital-gains tax cuts that are included in the distribution table, this means that the Joint Committee expects a net capital gains tax increase in calendar 2000 of $18.9 billion as a result of the tax cut plan.

Read the Full Report


    Want even more CTJ? Check us out on Twitter, Facebook, RSS, and Youtube!

GAO Report: Big Foreign-Controlled Firms Operating in U.S. Pay Lower Taxes than American Companies

April 14, 1999 04:35 PM | | Bookmark and Share

Click here  to see this analysis in PDF format.


A new report from the General Accounting Office for Senator Byron Dorgan (D-N.D.) shows that large foreign-controlled corporations doing business in the United States pay considerably less in U.S. corporate income taxes than similarly sized American companies.

According to GAO’s analysis, the 15,363 large American companies studied paid an average of $8.1 million in federal income taxes in 1995. In contrast, the 2,767 foreign-controlled corporations paid an average of only $4.2 million in federal income taxes that year–only half what the U.S. companies paid. This was true even though the average amount of gross receipts reported by the foreign-controlled companies was about the same as the amount reported by the American firms.

“As subsidiaries of overseas corporations, foreign-controlled companies doing business in the United States appear to have greater opportunities to manipulate their U.S. taxable income downward,” said Robert S. McIntyre, director of Citizens for Tax Justice. “Paying too much or charging too little in paper transactions with their foreign affiliates is the typical way that multinational companies shift income out of the United States for tax purposes. That is likely to explain much of the discrepancy in tax payments found in the GAO report.”

McIntyre warned that recent acquisitions of U.S. firms by foreign companies, such as the Chrysler-Daimler merger and the soon-to-be-completed $58 billion takeover of cell-phone giant AirTouch Communications by the British wireless firm Vodafone, may accentuate tax-avoidance problems in the future.

“Chrysler reported $879 million in federal income tax payments in 1995 and $963 million in 1996,” McIntyre noted. “One wonders whether that will fall off sharply now that Chrysler is foreign controlled.”

“Likewise, AirTouch paid a total of $248 million in federal income taxes from 1995 to 1997,” McIntyre noted. “With the recent IRS approval of Vodafone’s tax-free takeover of AirTouch, that amount may fall sharply, too.”

The Vodafone takeover of AirTouch was in technical violation of IRS regulations governing tax-free mergers, but the companies requested a waiver of the regulation. The waiver request raised objections from the Communications Workers of America and the AFL-CIO, but was nevertheless approved by the IRS this week.

McIntyre called on Congress and the Clinton administration to explore ways to address multinational tax avoidance problems, in particular by moving toward a simpler, formula approach to allocating multinational taxable profits among countries, rather than the cumbersome “transfer pricing” approach currently in use.

Large Corporations filing US Tax Returns in 1995*
  Number of Returns Average Gross Receipts ($-mill.) Average Income Tax ($-mill.) Total Income Taxes ($-bill.) % of Total Gross Receipts % of Total Income Taxes Paid Income Taxes / Gross Receipts
US-controlled 15,363 $ 520.9 $ 8.1 $ 124.6 85.1% 91.5% 1.56%
Foreign-controlled 2,767 505.8 4.2 11.6 14.9% 8.5% 0.83%
Totals, large corps. 18,130 $ 518.6 $ 7.5 $ 136.3 100.0% 100.0% 1.45%
NOTE:
Total 1995 corporate income taxes, all corporations ($-millions)   $ 156.4
% of all 1995 corporate income taxes paid by large corporations   87.1%
*Corporations with assets greater than $250 million or gross receipts greater than $50 million.
Source: U.S. General Accounting Office, Foreign- and U.S.-Controlled Corporations That Did Not Pay U.S. Income Taxes, 1989-95 (March 1999).

ADDENDUM:

The GAO defined large corporations as those with assets greater than $250 million or gross receipts greater than $50 million. Companies meeting this definition paid 87 percent of total federal corporate income taxes in 1995, the year studied. Corporations were classified as foreign-controlled or U.S.-controlled based on who owns the companies’ voting stock. In general, the foreign-controlled companies are U.S. subsidiaries of foreign-based corporations.


    Want even more CTJ? Check us out on Twitter, Facebook, RSS, and Youtube!

Fixing the “Marriage Penalty” Problem

February 1, 1999 03:45 PM | | Bookmark and Share

One of the vexations of married life in America is the marriage penalty imposed by the Internal Revenue Code. Virtually all married couples pay the marriage penalty. That is, marital partners could expect to reduce their combined income taxes by getting a divorce and entering into a well-crafted support and property-settlement agreement. As a practical matter, few middle- and upper-income couples divorce or fail to marry simply to avoid an extra tax bite.

Read the Full Article


    Want even more CTJ? Check us out on Twitter, Facebook, RSS, and Youtube!

Flat Tax Proposals: An Introduction to Recent Legislation

November 1, 1998 02:19 PM | | Bookmark and Share

CTJ, November 1, 1998


The “flat tax” was first proposed by two Stanford economists, Robert Hall and Alvin Rabushka, in their 1983 book “Low Tax, Simple Tax, Flat Tax.” The Hall-Rabushka plan, on which the Armey-Shelby bill is based, would replace the current personal income and corporate income tax structure with a two-level tax designed to tax all income exactly once, and at the same rate (in H-R’s version, 19 percent). A number of so-called “flat tax” plans have been proposed by various prominent Republicans to replace the current federal personal income tax and the corporate income tax. The prototype proposal was put forward by House Majority Leader Richard Armey (R-Tex.), and has been sketchily drafted into actual legislation sponsored by Armey and Sen. Richard Shelby (R-Ala.) Introduced as legislation in 1994 and reintroduced in 1995, the Armey-Shelby bill was last revised in March of 1997.


The Armey plan

    Among the key elements of the Armey plan are:

  • Individuals would report only wages and pensions on their individual tax forms. Small business owners would pay themselves a salary so they could file an individual tax form (along with a business tax form) to take advantage of the proposed exemptions from the wage tax.
  • Income from interest, dividends and capital gains would not be reported on any form.
  • All individual itemized deductions and credits would be eliminated. Thus, there would be no deductions for mortgage interest, state and local taxes, charitable contributions or extraordinary medical expenses; no credit for child-care expenses; and no earned-income tax credit for low- and moderate-income working families.
  • Most adult taxpayers would be allowed a personal exemption of $11,000 each (two exemptions for couples), except that unmarried parents would get a $14,400 exemption each. There would be an additional deduction of $5,000 per child.
  • The flat tax would also apply (without exemptions) to employer-paid fringe benefits, defined to include employer-paid health insurance, certain other fringe benefits and the social security taxes (7.65% of wages up to $63,700) that employers pay on their employees’ behalf. The new fringe benefits tax would be collected from all employers, including state and local governments and non-profit organizations. There is general agreement that its burden would fall on workers in the form of reduced benefits and/or cash wages.
  • Businesses would file tax forms similar to the current forms, except that (a) all capital investments and inventory purchases would be deductible immediately, rather than depreciated or deducted when goods are sold; (b) business income from dividends and capital gains would not be reported; (c) interest income would not be included in income and interest expenses would not be deductible; and (d) outlays for tickets to sporting events, country club memberships, skyboxes, business meals, etc. would be 100% deductible, rather than only 50% deductible (or completely non-deductible) as under current law.
  • The federal estate tax would be repealed.
  • There would be no transition rules from the old system to the new one. Thus, for example, businesses would lose unused depreciation deductions on previous purchases of machinery and buildings.
  • Rep. Armey proposes a 20% tax rate in 1997 and 1998, dropping to 17% starting in 1999.
  • According to both Armey and the Treasury Department, at the proposed 20% rate and assuming no transition rules and no changes in taxpayer behavior to avoid the new tax, Armey’s plan would lose at least $30 billion a year in tax revenues. At Armey’s promised 17% rate, Treasury says the plan would add $138 billion to the annual budget deficit (in 1996 dollars).

According to the Treasury Department, at what Treasury says is a break even rate of 20.82% (or for that matter, at Armey’s proposed 20% rate), the Armey plan would increase taxes sharply on all income groups except those earning more than $200,000 a year. (Others believe that the break-even rate would have to be considerably higher than Treasury finds.)


Malcolm S. Forbes, Jr.

    Malcolm S. Forbes, Jr. has proposed a flat tax plan similar to Armey’s except that:

  • Forbes’s exemptions from the wage tax portion of the plan would be considerably larger than under the Armey plan: $13,000 per taxpayer plus $5,000 per child.
  • The tax rate under the Forbes plan would be 17% immediately.
  • Recently, Forbes has indicated that he may retain the earned-income tax credit (he gave different stories to Time and Fortune).

Based on Treasury’s analyses of the Armey plan, Forbes’s proposal would appear to entail a revenue shortfall of between $180 and $210 billion a year (in 1996 dollars). Others believe the revenue losses to be much larger..


The Kemp Commission

    The Kemp Commission endorsed an Armey-style flat tax, but with a number of amendments:

  • Itemized deductions, for mortgage interest, charitable donations and, apparently, state and local taxes would be retained.
  • Employer-paid social security taxes would not be subject to the flat tax as a “fringe benefit.” In addition, workers would deduct their share of social security taxes from their taxable wage income on their individual tax return.
  • The Commission called for “transition rules” to “protect” profits generated from existing investments. That would apparently entail allowing unused depreciation write-offs, perhaps some interest deductions, and many other deductions.
  • TThe Commission called for exempting multinational corporations from tax on their tax-haven activities—and probably on most of their domestic activities, as well.
  • The Commission did not specify a tax rate or wage-tax exemptions, but called for a rate “as low as possible” and for “generous” exemptions.

Based on Treasury’s analysis of the Armey plan, the Kemp proposal would appear to entail an increase in the budget deficit in excess of $300 billion a year, or a tax rate in excess of 30%.


Sen. Phil Gramm (R-Tex.)

    Sen. Phil Gramm (R-Tex.) has proposed a very sketchy flat tax plan, with several notable differences from the Armey proposal:

  • Individuals would still report capital gains on their tax forms, but the portion of capital gains subject to tax would be reduced, by indexing the basis of capital assets for inflation.
  • Businesses would continue to depreciate capital investments, rather than write them off immediately, but depreciation deductions would be increased from the already generous write-offs allowed under current law.
  • While not spelled out in detail, individuals would apparently continue to report dividends on their tax forms, but companies would apparently get a deduction for dividends paid.
  • Itemized deductions for mortgage interest and charitable donations would be retained.
  • The standard deduction would be $11,000 per taxpayer, plus $5,000 per child–about the same as under the Armey plan.
  • The treatment of interest is undefined. It may be similar to the Armey plan, which takes interest income and deductions entirely out of the tax system. Or it may retain current law’s treatment of interest income and expenses.
  • The treatment of employee fringe benefits (including employer-paid social security taxes) is not specified. But it is implied that most fringe benefits would be taxed.
  • There is no explanation of what would happen to existing tax credits, including the earned-income tax credit.
  • The flat tax rate would be 16%.

Not enough details have been provided by Sen. Gramm to understand his plan fully, but its revenue cost almost certainly exceeds $200 billion annually, and may exceed $300 billion a year.


    Want even more CTJ? Check us out on Twitter, Facebook, RSS, and Youtube!

Who Pays Capital Gains Taxes?

June 26, 1998 05:38 PM | | Bookmark and Share

With all the persistent talk in Washington about cutting taxes even further on profits from selling stocks and bonds, it might be useful to point out who pays those “capital gains taxes” under current law. The attached table provides details. A few items stand out:

  • Just over two-thirds of American taxpayers make less than $50,000 a year. Their average federal income tax in 1999 will come to $1,045. Of that, only $12–or 1.2%–represents taxes on capital gains.
  • Just over a fifth of all taxpayers make between $50,000 and $100,000. Their average income tax on capital gains is $179–which is only 2.3% of their total federal income tax.
  • In contrast, 2% of all taxpayers make more than $200,000 a year. The average income tax paid on capital gains by this top-income group is $20,675. Overall, taxpayers making more than $200,000 now pay more than three-quarters of all income taxes paid on capital gains.
Who Pays Capital Gains Taxes?
Federal Income Taxes on Capital Gains Under Current Law in 1999
Income
(in thousands)
% of
Taxpayers
Average
Income
CG Tax/ Total
Income Tax
Average Tax on
Capital Gains
% of All
Cap Gains Taxes
Average Income Tax % of Total
Income Tax
<$10 12.2% $ 6,600 $ — $ –267 –0.5%
$10-20 20.0% 14,900 nm 2 0.1% –104 –0.3%
$20-30 16.7% 25,000 0.8% 8 0.2% 984 2.7%
$30-40 11.5% 34,500 0.9% 20 0.4% 2,225 4.2%
$40-50 9.2% 44,800 1.3% 52 0.9% 3,921 5.9%
$50-75 14.6% 61,300 2.0% 126 3.4% 6,387 15.2%
$75-100 7.1% 85,800 2.6% 288 3.8% 10,901 12.6%
$100-200 6.0% 132,500 6.1% 1,248 13.9% 20,410 20.2%
$200+ 2.0% 525,400 17.1% 20,675 77.3% 120,939 40.1%
ALL 100.0% $ 49,600 8.9% $ 541 100.0% $ 6,108 100.0%
ADDENDA:
<$50 69.6% $ 23,000 1.2% $ 12 1.6% $ 1,045 11.9%
$50-100 21.7% 69,300 2.3% 179 7.2% 7,863 27.9%
Notes: Lowest income group excludes returns with negative incomes. “nm” = not meaningful, because average current personal income tax, after credits, is less than zero.
Source: Institute on Taxation & Economic Policy Microsimulation Tax Model.
Citizens for Tax Justice, June 26, 1998.

    Want even more CTJ? Check us out on Twitter, Facebook, RSS, and Youtube!

Notes on the Budget Surplus and Capital Gains

June 23, 1998 05:39 PM | | Bookmark and Share

Fiscal 1998’s continuation of the strong federal tax revenue growth that began in fiscal 1993, along with severe spending restraints, makes the first federal budget surplus since the Johnson administration highly likely this year.


  • Through May of this fiscal year, the federal government has run a surplus of $16 billion. CBO and OMB now expect the full fiscal year 1998 surplus to be $40 billion or more.


  • The 1998 surplus so far has been driven by a $103 billion increase in revenues in fiscal 1998 through May compared to the same period in fiscal 1997. The table below shows the sources of that revenue increase through May.
  • In contrast, federal spending in fiscal 1998 through May is up by only 2 percent ($21 billion) compared to the same period in fiscal 1997 (although because of calendar quirks the true spending increase is closer to 3%(1)).


Revenue Changes in Fiscal 1998 Compared to Fiscal 1997
Through May of Each Fiscal Year, $-billions
$-change % change % of Total Increase
Taxes withheld from wages (income & payroll taxes) +$67.0 +9.2% 65%
Other personal income tax payments +22.7 +13.0% 22%
Personal income tax refunds (– = larger refunds) –5.1 +5.9% –5%
Corporate income taxes +6.9 +7.0% 7%
Other taxes +7.0 +8.5% 7%
Non-tax revenues (mainly Federal Reserve) +4.5 +23.2% 4%
TOTAL CHANGE IN REVENUES +$103.0 +10.1% 100%
Total Change in Spending +$21.3 +2.0%  

The “surplus,” of course, is only a surplus if one counts the build-up in the Social Security trust funds that will be needed to pay future benefits. Without the $102 billion expected 1998 surplus in the Social Security trust funds, the government is expected to spend upwards of $50 billion more than it takes in this fiscal year.

This year’s high revenue growth, although greater than was predicted when last year’s budget agreement was completed, is merely a continuation of strong revenue growth that began in 1993 (see chart). Total federal tax revenues have risen by an average of 7.7% a year since 1993, including a now anticipated rise of 7.5% in fiscal 1998 for the full year. Meanwhile, federal spending has risen by only 3% per year. Thus, the current surplus has been several years in the making.

The surge in tax revenues that began in 1993 has been driven both by the strong economy and by the upper-income tax increases that were enacted and took effect in 1993:

  • The number of income tax filers has risen considerably faster than the growth in population, probably reflecting the sharp drop in unemployment.
  • Personal income taxes have risen faster than total reported income, due to strong income growth.
  • The 1993 tax legislation has raised more revenue than anticipated because of growth in the number and income of the affluent (and notwithstanding the significant tax cuts enacted in 1993 for low- and moderate-income working families).
Growth in Selected Items 1990 to 1998 (Estimated)
Calendar Years Adjusted Gross Income Taxable Income Personal Income Tax Wages on Tax Returns # of Tax Returns Reported Capital Gains Stock Market
1990 +4.6% +3.8% +3.2% +6.1% +1.4% –19.4% –9.8%
1991 +1.7% +0.9% –0.4% +2.9% +0.9% –10.0% +28.3%
1992 +4.7% +4.9% +5.9% +4.9% –1.0% +13.7% +4.7%
1993 +2.6% +2.4% +5.3% +3.1% +0.9% +20.2% +7.7%
1994 +4.9% +5.9% +5.6% +4.7% +1.2% +0.3% –2.9%
1995 +7.2% +8.3% +9.5% +5.8% +2.0% +17.9% +32.3%
1996p +8.7% +10.2% +12.3% +6.1% +2.0% +39.8% +17.4%
1997e na na +10.1% na +2.0% na +31.5%
1998e na na +7.8% na +2.0% na na
Sources: Internal Revenue Service (1996 is preliminary data); Office of Management and Budget, May 1998; New York Stock Exchange. “na” = not available.

Although most major taxes have contributed to the rise in revenues, personal income tax revenues have grown especially rapidly in recent years. Personal income tax revenues rose by 8.1% in fiscal 1995, 10.8% in fiscal 1996, and 12.3% in fiscal 1997. Through May of this year, fiscal 1998 personal income tax revenues are up by 11.7% compared to the same period in fiscal 1997, and are now anticipated to be up by 10% for the full 1998 fiscal year. On a calendar tax-year basis, personal income taxes rose by:

  • 9.5% for tax year 1995,
  • 12.3% for tax year 1996, and
  • based on the latest fiscal year figures and estimates, probably rose by about 10% for tax year 1997 and should rise by about 8% for tax year 1998.

Is it Capital Gains?

Some leaders in Congress see the latest tax revenue data as evidence that the 1997 reduction in capital gains tax rates has been a major cause of recent revenue growth. 
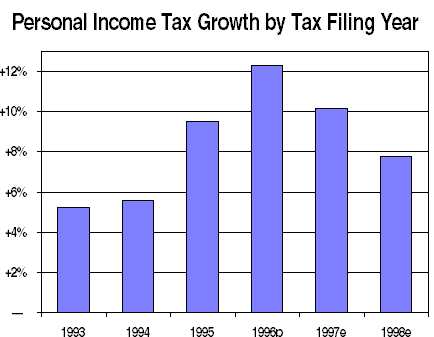
Indeed, GOP leaders are reportedly pressuring the nonpartisan analysts at the Congressional Budget Office and the Joint Committee on Taxation to adjust their tax models so that they will show an additional capital gains tax cut as a huge revenue raiser. There are several flaws in this theory, however.

For one thing, two-thirds of the revenue increase through May of fiscal 1998 compared to fiscal 1997 has come from increased taxes withheld from wages. As for capital gains, any increase merely reflects a long-term trend, not a response to last year’s tax cut:

  • Reported capital gains have risen rapidly along with the booming stock market. According to recently released preliminary data from the IRS, reported gains doubled over the calendar 1993-96 period, including an 18% increase on tax returns filed for 1995 and a huge 40% jump on 1996 tax returns. Thus, capital gains were skyrocketing long before the 1997 capital gains tax cut took effect (in May of 1997). The 65% total increase in reported gains in 1995 and 1996 was driven not by changes in tax policy, but rather by a 55% surge in the stock market.
  • Because of the 1997 capital gains tax cut, reported gains in calendar 1997 will have had to continue their torrid growth pace of the previous two years just to break even with the $64 billion in capital gains taxes paid on calendar 1996 returns.
  • Given the strong performance of the stock market in 1997 (up 31%), we may well discover that reported capital gains did continue to increase rapidly in 1997. (No IRS data will be available until late 1998 or early 1999.) After all, reported gains slightly outpaced the growth in the stock market in 1995 and 1996. But given the pre-tax-cut history, it will probably be hard to give the 1997 capital gains tax cut much of the credit for whatever increase in capital gains realizations did occur in 1997. In fact, CBO now predicts that reported capital gains rose about the same amount in 1997 that they did in 1996 (but does not expect that jump to be sustained in 1998 and later years.)

Recently, House Speaker Newt Gingrich told reporters that the Joint Committee on Taxation has almost doubled its estimate of the amount of capital gains realized in tax year 1997, and has attempted to give the credit for that change to the 1997 capital gains tax cut. But Gingrich’s contention is false. What really happened is that the Joint Committee sharply revised its capital gains baseline for 1997 in light of new data from the IRS showing a 40% jump in capital gains in 1996.

In other words, Gingrich is trying to give the 1997 tax act credit for the surge in capital gains that took effect in 1996, the year before it was enacted. To be sure, Gingrich recognizes that this is a hard case to make. But Gingrich is reportedly relying on a novel theory put forward by former Reagan economic adviser Larry Kudlow to contend that the 40% surge in capital gains realizations in 1996 reflects investors’ mistaken expectation that Congress would pass a large, retroactive capital gains tax cut sometime late in 1996.

Let’s recall a little history. On November 30, 1995, not long before the government shutdown, Congress did indeed send a major capital gains tax cut to the President (as part of its budget reconciliation bill). The measure was quickly vetoed by President Clinton. That was the end of any serious consideration of a capital gains tax cut until the 1997 budget agreement.

So, there was no basis for investors to believe in 1996 that there was any chance that a retroactive capital gains tax cut could pass Congress and be signed by the President.

Conclusion: So here’s what we know at this point:

  • The anticipated surplus in 1998 stems from both higher revenues and reduced spending.
  • Almost two-thirds of the revenue hike so far in fiscal 1998 has come from increased taxes withheld on wages (largely reflecting the low unemployment rate).
  • The surge in capital gains realizations began long before the 1997 capital gains tax cut took effect, and appears to have mainly reflected the strong growth in the stock market. As a result, further capital gains tax cuts are extremely unlikely to increase tax revenue; on the contrary, such tax cuts will probably prove to be very costly.


Fiscal Year Growth in Tax Revenues from Previous Fiscal Year Growth in Spending from Previous Fiscal Year
1990 +3.7% +9.6%
1991 +2.7% +5.7%
1992 +2.9% +4.2%
1993 +6.6% +1.9%
1994 +8.8% +3.6%
1995 +6.9% +3.4%
1996 +7.7% +2.7%
1997 +8.8% +2.5%
1998e +7.5% +3.9%
1999e +3.9% +3.8%
2000e +2.6% +2.5%
93-98 ave +7.7% +3.0%

 federal taxes and spending
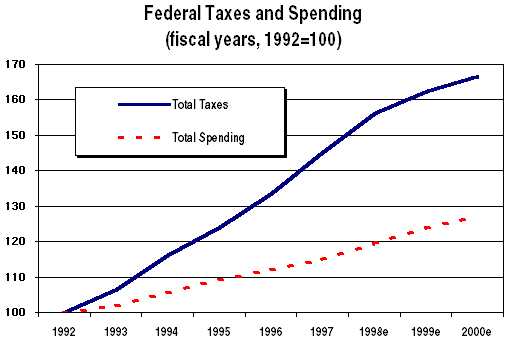
Sources for all data and estimates:  Internal Revenue Service for calendar year tax data through tax year 1996 (the latest available). Office of Management and Budget for tax and spending data for fiscal years through 1997. Treasury Department “Monthly Budget Statements” for tax revenues and spending by month in fiscal 1998 through May. Office of Management and Budget (May 1998) and Congressional Budget Office (June 1998) for revenue and spending estimates beyond May of 1998.


    Want even more CTJ? Check us out on Twitter, Facebook, RSS, and Youtube!

What Marriage Penalty? Phony Figures in the Tax Debate

June 12, 1998 03:54 PM | | Bookmark and Share

As they talk about tax simplification, both the Republican Congress and the Democratic president have been enthusiastic about creating disparities among taxpayers of similar incomes– especially when it comes to treating investment income more favorably than wages. But now many in Congress are making a great cause of one particular differential: the one between married and unmarried couples. So strong is the pressure to do something about the so-called “marriage penalty” that the stalled tobacco bill gained momentum in the Senate this week from the inclusion of a provision to give an income tax break to low and moderate income married couples.

Read the Full Article


    Want even more CTJ? Check us out on Twitter, Facebook, RSS, and Youtube!