March 9, 2016 11:20 AM | Permalink | ![]()
For all of the candidates running for president one thing should be clear: years of tax cuts have put our country on a precarious fiscal trajectory. According to the Congressional Budget Office (CBO), the federal government faces an $8.6 trillion cumulative budget deficit over the next 10 years. The nation must raise more revenue to fund its priorities and prevent unsustainable deficits. Yet each of the remaining major Republican presidential candidates who have laid out tax plans propose to enact trillions in tax cuts over the next decade.
While the candidates have touted their planned tax cuts, they have provided little or no detail on how they would make up the lost revenue. Given the sheer size of our projected deficits, this means that the tax cut proposals would, if enacted, inevitably force draconian spending cuts and/or substantial tax increases. In other words, a tax cut paid for with borrowed money now inevitably will lead to big tax increases and/or huge program cuts later.
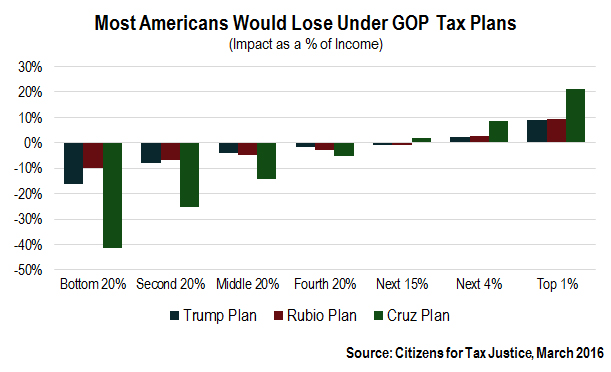
For this reason, a complete analysis of each candidate’s tax plan should include the impact of necessary future spending cuts and tax increases that the plans would require. This CTJ report not only provides a distributional analysis of how the candidates’ plans would affect taxpayers on average based on income quintile, it also provides a blanket distributional analysis of the economic impact on each quintile of tax increases and spending cuts. This analysis concludes that when the tax cuts and their likely offsets are accounted for, only the wealthiest Americans would receive a net benefit, while the vast majority of Americans would be much worse off.
Assessing the Impact of Spending Cuts and Tax Increases
Although no one can predict how the cost of the tax cuts proposed by each candidate would be paid for in the future, this analysis takes a middle ground approach by assuming that they would be paid for half by spending cuts and half by an across-the-board income tax increase. This is roughly what happened after the 1981 Reagan tax cuts: as it became clear that the tax cuts were unaffordable, Congress significantly cut domestic spending, including Social Security benefits, and increased taxes multiple times.
To model the effect of the spending cuts on Americans at different income levels, we allocate the impacts on a per capita basis, with each American seeing the same dollar “cost” from spending cuts. This sensible assumption yields an analysis that shows the impact of spending cuts to be highly regressive, with low-income families bearing the biggest costs relative to their income. But, as we have stated, no one can forecast how candidates’ tax cuts would be paid for in the future. The distributional effect would skew even more regressive if candidates’ proposed tax cuts were paid for primarily by reducing spending on programs that benefit low-income people. On the tax side, our analysis allocates tax increases according to the overall distribution of personal income. Notably, this mix of spending cuts and income tax increases is a more progressive approach than the “spending cuts only” approach the Republican candidates have advocated. One other caveat: in the unlikely scenario that these tax plans were paid for entirely through spending cuts—and no tax increases— the distributional impact would be devastating for middle- and low-income Americans.
Our analysis shows the impact of immediately implementing both the tax cuts and offsetting spending cuts and tax increases based on current economic conditions. This is, of course, an oversimplification: in reality, offsetting spending cuts and tax increases would likely occur years in the future, meaning that even bigger cuts would be required to offset the additional expense of servicing the interest on our growing national debt.
Analytic constraints aside, we are confident that our analysis offers a far more accurate measure of the true effects of the proposed GOP tax cuts than previous analyses, which show only the effects of the tax cuts (ignoring how they will be paid for). Taking into consideration the impact of spending programs in this way dramatically alters the apparent effect of a tax plan. For example, CTJ recently analyzed the impact of the tax increases that Bernie Sanders has proposed to pay for his universal health insurance plan, factoring in both the higher cash wages that would result from his plan for most workers and the fact that workers would still get the same or better health insurance compared to what they have now. CTJ’s analysis found that all but the very top income groups would come out ahead under Sanders’s proposals. In contrast, other groups’ analyses solely looked at the tax changes and didn’t consider the benefits of universal health insurance, and thus found that all income groups would be worse off under Sanders’ plan.
What follows are our estimates of the distributional breakdowns of Donald Trump’s, Ted Cruz’s and Marco Rubio’s tax proposals, when the impacts of future spending and tax changes are taken into account.
Donald Trump’s Tax Plan
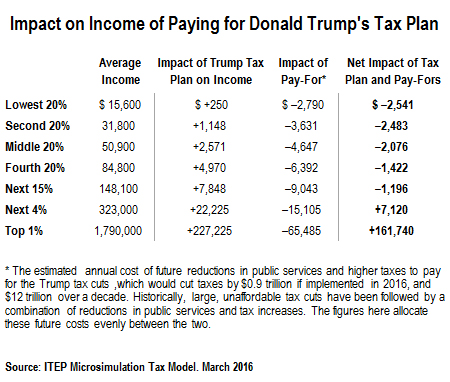
Donald Trump’s tax plan would cut taxes by $12 trillion over the next decade by significantly reducing marginal tax rates and substantially increasing the standard deduction. Trump’s tax cut proposal reduces taxes for all income groups on average but is highly skewed to the rich, with the bottom 20 percent receiving an average tax cut of $250, the middle 20 percent an average tax cut of $2,571 and the top 1 percent an average tax cut of $227,225.
As the table below shows, when the impact of future spending cuts and tax increases is tallied, the picture looks very different. In this more complete analysis, only the top 5 percent of taxpayers would see a net benefit from implementing, and paying for, the Trump tax plan. For the lowest 20 percent, the average implicit cost of the tax cuts would be $2,790, leading to a net loss of $2,541. For the middle 20 percent, the average implicit cost of the tax cuts would be $4,647, leading to a net loss of $2,076. In contrast, the top 1 percent would see an average implicit cost of $65,485, much less than the $227,255 they would receive in tax cuts on average, leading to a net gain of $161,740.
Ted Cruz’s Tax Plan
Ted Cruz’s tax plan would cut taxes by $13.9 trillion over the next decade by sharply reducing the personal income tax and replacing the corporate income tax, estate tax and payroll tax with a new 19 percent value-added tax. Cruz’s tax cut proposal is already highly skewed to benefit higher income people, with the bottom 20 percent seeing an average tax increase of $3,161 dollars and the middle 20 percent, an average tax increase of $1,943. The top one percent, however, would get an average tax cut of $435,854.
As the table below shows, when the impact of future spending cuts and tax increases is accounted for, only the top 20 percent of taxpayers would receive any net benefit. For the lowest 20 percent, the average implicit cost of the tax cuts would be $3,073 leading to a net loss of $6,234. For the middle 20 percent, the average implicit cost of the tax cuts would be $5,108, leading to a net loss of $7,051. In contrast, the top one percent would see an average implicit cost of $72,147, much less than the $435,854 they would receive in tax cuts on average, leading to a net gain of $363,707.
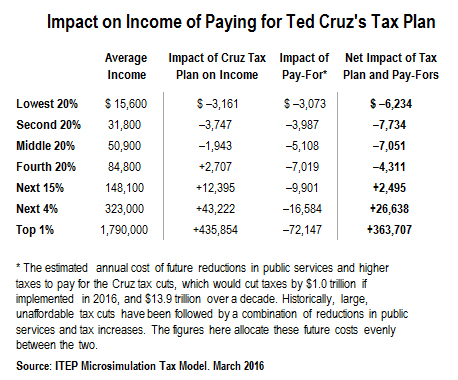
Note: We have adjusted our estimated cost of Cruz’s tax cuts downward somewhat from our previous estimate, based on new information that his advertised 16% value-added tax (a.k.a. national sales tax) would actually impose a tax rate of 18.56%.
Marco Rubio’s Tax Plan
Marco Rubio’s tax plan would cut taxes by $9 trillion over the next decade by, among other things, lowering marginal tax rates, eliminating the capital gains tax and enacting a new partially refundable child tax credit. Rubio’s tax cut proposal is highly skewed toward the rich, with the bottom 20 percent receiving an average tax cut of only $778 dollars and the middle 20 percent receiving an average tax cut of $1,435. The top one percent, however, would get an average tax cut of $223,763.
As the table below shows, when the impact of future spending cuts and tax increases is factored, only the top 5 percent of taxpayers would see any net benefit. For the lowest 20 percent, the average cost of the tax cuts would be $2,340, leading to a net loss of $1,563. For the middle 20 percent, the average cost of the tax cuts would be $3,897, leading to a net loss of $2,462. In contrast, the top 1 percent would see an average implicit cost of $54,920, much less than the $223,763 they would receive in tax cuts on average, leading to a net gain of $168,843.
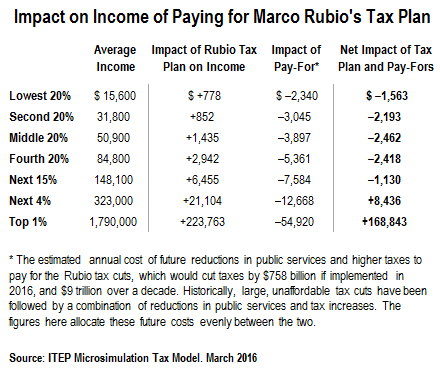
Note: We have adjusted our estimated size of Rubio’s tax cuts downward somewhat from our previous estimate, based on new information that his advertised “refundable” standard credit would not be nearly as refundable as he has publicly claimed, and that the new credit would replace not only the standard deduction but also taxpayer personal exemptions (but not dependents’ exemptions).
Conclusion: There’s No Free Lunch
When policymakers or candidates propose changing our tax system, it’s important to understand how the proposed changes would affect people at different income levels. But when these plans would result in unsustainable budget deficits on top of the fiscal shortfalls our nation already faces, it’s equally vital to understand how Americans would be affected by the mix of spending cuts and other tax increases that would be required to pay for these tax proposals. As this report shows, when those inevitable spending cuts and tax increases are taken into account, the vast majority of Americans will end up as big losers.


Want even more CTJ? Check us out on Twitter, Facebook, RSS, and Youtube!