August 31, 2000 12:49 PM | Permalink | ![]()
Click here to see this analysis in PDF format.
| Note: CTJ has released more up-to-date data on the impact of the Bush plan. To see the most recent estimates, click here. |
Overview
Republican presidential candidate George W. Bush has proposed a very large federal tax cut as the centerpiece of his campaign. The $1.9 trillion ten-year cost of the plan would use up more than all of the projected budget surpluses over the next ten years, excluding the surpluses in the Social Security and Medicare trust funds. Most of the proposed tax cuts would go to upper-income taxpayers, with 43 percent of the tax cuts targeted to the top one percent.
Description of the Plan
In early December of 1999, George W. Bush announced a plan for large-scale tax reductions. The plan was clarified and amended in May 2000. The principal components of the Bush plan are:
- A major reduction in personal income tax marginal rates (accounting for just under half the total Bush tax cut). Specifically:
- The current 39.6% top rate would drop to 33%.
- The current 36% rate would drop to 33%.
- The current 31% rate would drop to 25%.
- The current 28% rate would drop to 25%.
- The current 15% tax bracket would be retained over most of its range.
- A new 10% bottom bracket would apply over about a quarter of the range of the current 15% bracket.
(The revised and clarified Bush tax plan does not adjust the current 26% and 28% tax rates for the Alternative Minimum Tax (AMT), which taxpayers must pay if it exceeds their regular tax due. As a result, a substantial portion of the income tax cuts his plan seems to promise to taxpayers currently in the 28% through 36% tax brackets would be obviated by the AMT.)
- The $500 per child tax credit would be doubled and extended to much higher-income families. Two-earner couples would get a special deduction of up to $3,000. Taxpayers who don’t itemize deductions could nevertheless deduct charitable contributions. And a few other personal tax breaks would be provided. (These changes account for a quarter of the total Bush tax cuts.)
- The rest of the Bush tax cuts reflects repeal of the federal wealth tax on very large estates (24% of the total tax cut) and tax breaks for corporations (2% of the total).
Distributional Effects
Most of the Bush tax cuts would go to taxpayers in the top end of the income scale:
- Three-fifths of the tax cuts would go to the best off 10 percent of all taxpayers.
- Some 43 percent of the tax cuts would go to the top one percent, those making more than $319,000 a year, with average incomes of $915,000 in 1999. The average tax cut for the top one percent would be $46,000 a year.
In contrast, the average Bush tax cut for the bottom 60 percent of taxpayers would be only $227 a year.
| Effects of George W. Bush’s Revised Tax Plan (Annual effects at 1999 income levels) |
|||||||
| Income Group | Income Range | Average Income | Average Tax Cut | % of Total Tax Cut | |||
| Lowest 20% | Less than $13,600 | $ 8,600 | $ –42 | 0.8% | |||
| Second 20% | $13,600–24,400 | 18,800 | –187 | 3.5% | |||
| Middle 20% | $24,400–39,300 | 31,100 | –453 | 8.4% | |||
| Fourth 20% | $39,300–64,900 | 50,700 | –876 | 16.2% | |||
| Next 15% | $64,900–130,000 | 86,800 | –1,447 | 20.1% | |||
| Next 4% | $130,000–319,000 | 183,000 | –2,253 | 8.4% | |||
| Top 1% | $319,000 or more | 915,000 | –46,072 | 42.6% | |||
| ALL | $ 50,800 | $ –1,070 | 100.0% | ||||
| ADDENDUM | |||||||
| Bottom 60% | Less than $39,300 | $ 19,500 | $ –227 | 12.6% | |||
| Top 10% | $92,500 or more | 218,000 | –6,410 | 59.4% | |||
| Source: Institute on Taxation and Economic Policy Tax Model, May 2000. | |||||||
The Cost of the Bush Tax Cuts
Based on official projections from the Congressional Budget Office and the Joint Committee on Taxation, the Bush tax cut plan would use up slightly more than all of the projected budget surpluses over its first ten years, not counting the surpluses in the Social Security and Medicare trust funds. Over the fiscal 2002-11 period, the Bush tax cuts would cost $1.9 trillion, while the projected surpluses are only $1.8 trillion.
In fact, the Bush tax cuts effects on the surpluses is even greater than that. As is well known, the official surplus projections are substantially overstated, because, among other things, they assume that federal appropriations keep up with inflation only, with no adjustment for population growth or real wage growth. If, for example, one assumes that appropriations will probably keep up with the economy, then the projected surpluses over the 2002-11 period (excluding Social Security & Medicare) fall from $1.8 trillion to only $770 billion. Thus, in all likelihood, the Bush tax cuts would use up far more than the likely surpluses over the next decade. That would require dipping heavily into the Social Security and/or Medicare trust funds to cover the cost of the tax cuts.
| Revised G.W. Bush tax cuts estimates (interest at 5.5%) over ten years (FY 2002-11) | |||||||||||
| Fiscal Years, $-bill. | 2002 | 2003 | 2004 | 2005 | 2006 | 2007 | 2008 | 2009 | 2010 | 2011* | 10 yrs |
| Tax cuts (JCT 02-10) | $ 21.1 | $ 57.4 | $ 88.9 | $ 125.5 | $ 167.1 | $ 193.2 | $ 210.0 | $ 224.5 | $ 232.9 | $ 243.7 | $ 1,564.3 |
| Interest (5.5% rate)** | 0.6 | 2.8 | 6.9 | 13.2 | 22.0 | 33.1 | 46.0 | 60.5 | 76.4 | 93.7 | 355.3 |
| Total effect | $ 21.7 | $ 60.2 | $ 95.8 | $ 138.7 | $ 189.1 | $ 226.3 | $ 256.0 | $ 285.0 | $ 309.3 | $ 337.4 | $ 1,919.6 |
| *Tenth year (FY 2011) is Citizens for Tax Justice estimate. **Based on latest CBO interest rate estimates. Source: Except as noted, figures are from Joint Committee on Taxation, “Estimated Revenue Effects of Various Provisions Described as the ‘George W. Bush Tax Reduction Proposal,’ ” May 3, 2000. ADDENDUM (8/2000): With more recent official revenue projections under current law, cost of Bush tax plan will be higher. |
|||||||||||
| ADDENDUM: | 2002 | 2003 | 2004 | 2005 | 2006 | 2007 | 2008 | 2009 | 2010 | 2011* | 10 yrs |
| Surpluses per CBO (July 2000), excluding Social Security & Medicare (A) | $ 70 | $ 86 | $ 103 | $ 114 | $ 132 | $ 180 | $ 223 | $ 254 | $ 301 | $ 361 | $ 1,824 |
| Bush tax cut uses | 31% | 70% | 93% | 122% | 143% | 126% | 115% | 112% | 103% | 93% | 105% |
| Surpluses if appropriations keep up with the economy | $ 56 | $ 59 | $ 60 | $ 55 | $ 49 | $ 72 | $ 91 | $ 94 | $ 107 | $ 127 | $ 769 |
| Bush tax cut uses | 39% | 101% | 160% | 252% | 384% | 315% | 281% | 305% | 290% | 266% | 250% |
Addendum: Regarding Bush’s Claim That His Tax Plan Favors the Poor
According to the “Fact Sheet” accompanying George W. Bush’s Dec. 1, 1999 announcement of his tax plan, “The Bush tax cuts benefit all Americans, but reserve the greatest percentage reduction for the lowest income families.”
This statement is false. Bush’s proposed tax cuts do not benefit all Americans, and they do not provide the largest percentage reduction to lower-income people. In fact, more than a quarter of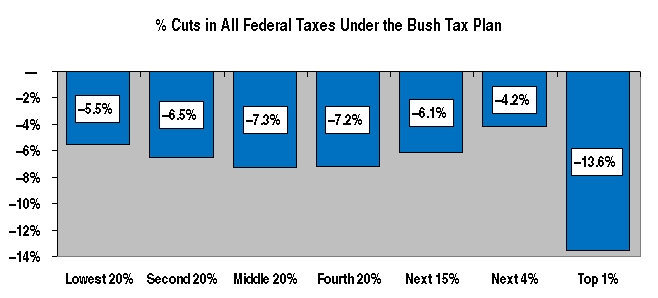 taxpayers would get nothing at all from the Bush plan. Moreover, as a share of current federal taxes, the Bush plan (as revised in May 2000) amounts to:
- a 5.5% reduction for the bottom 20%,
- an 7.3% reduction for those in the middle and
- a 13.6% tax cut for the best-off one percent.
In dollars, the Bush plan would cut total federal taxes for the lowest fifth from an average of $756 a year now to $714, a reduction of only $42 a year. Taxpayers in the middle of the income scale would see their average federal tax liability cut from $6,195 to $5,742, a reduction of $453. But those at the top would see their taxes cut by an average of more than $46,000 a year.
Over-spin: To assert that his tax plan favors those at lower income levels, Bush chose to misleadingly focus on only one federal tax, the personal income tax. But because the income tax is progressive, it imposes little or no burden on lower income taxpayers now. In fact, most of the federal taxes that lower- and middle-income people pay reflect Social Security payroll taxes and excise taxes, neither of which is affected by Bush’s plan.
Measuring the fairness or unfairness of any tax proposal by its percentage change in taxes for different income groups is almost always a misleading exercise because the current federal tax system is modestly progressive. Much more relevant measures are to look at proposed tax cuts for different income groups: (a) in average dollar terms, (b) as shares of the total tax cuts, and (c) as shares of income. By any of these measures, Bush’s plan is clearly targeted at the upper end of the income scale:
| Average Dollar Cut | Share of Total Cut | Tax Cut/Income | |
| Lowest 20% | $ 42 | 0.8% | 0.5% |
| Middle 20% | 453 | 8.4% | 1.5% |
| Top 1% | 46,072 | 42.6% | 5.0% |


Want even more CTJ? Check us out on Twitter, Facebook, RSS, and Youtube!