March 15, 2002 04:08 PM | Permalink | ![]()
Click here to see this analysis in PDF format.
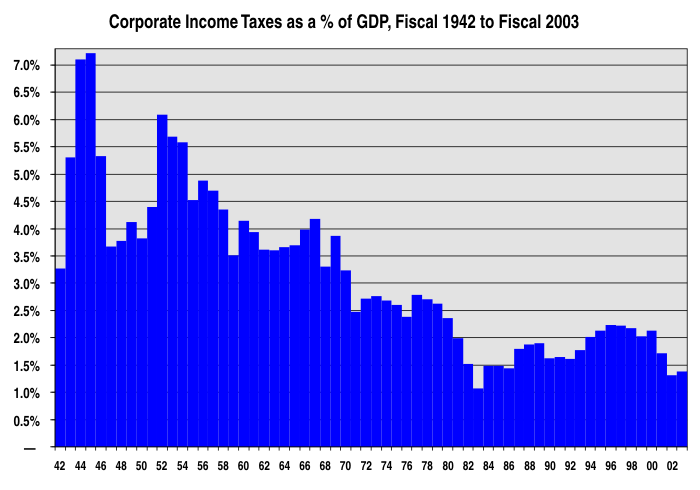
The big corporate tax cut bill just passed by Congress and signed by President Bush will slash corporate income tax payments this year to their lowest level as a share of the economy since the early Reagan administration. This will be the second lowest level in the past 60 years.
The latest data from the Congressional Budget Office and the Joint Committee on Taxation indicate that corporate taxes will plummet to only 1.3 percent of gross domestic product this year. That will be the lowest since fiscal 1983, when corporate taxes bottomed out at 1.1 percent of the GDP level on the heels of the huge corporate tax reductions enacted in 1981.
Despite the expected economic recovery, the continuing effects of the 2002 corporate tax cuts will keep next year’s corporate tax payments at only 1.4 percent of GDP, the third lowest level in the past 60 years.
In comparison, over the past 60 years corporate income taxes averaged:
- 5.6 percent of the GDP during World War II,
- 4.5 percent in the Truman and Eisenhower administrations,
- 3.7 percent under Kennedy and Johnson,
- 2.7 percent under Nixon and Ford,
- 2.4 percent under Carter,
- 1.6 percent in the Reagan and Bush I administrations, and
- 2.1 percent under Clinton.
| Corporate Income Taxes as % of GDP, 1942-2003 | |||||
| 1942 | 3.3% | 1963 | 3.6% | 1984 | 1.5% |
| 1943 | 5.3% | 1964 | 3.7% | 1985 | 1.5% |
| 1944 | 7.1% | 1965 | 3.7% | 1986 | 1.4% |
| 1945 | 7.2% | 1966 | 4.0% | 1987 | 1.8% |
| 1946 | 5.3% | 1967 | 4.2% | 1988 | 1.9% |
| 1947 | 3.7% | 1968 | 3.3% | 1989 | 1.9% |
| 1948 | 3.8% | 1969 | 3.9% | 1990 | 1.6% |
| 1949 | 4.1% | 1970 | 3.2% | 1991 | 1.6% |
| 1950 | 3.8% | 1971 | 2.5% | 1992 | 1.6% |
| 1951 | 4.4% | 1972 | 2.7% | 1993 | 1.8% |
| 1952 | 6.1% | 1973 | 2.8% | 1994 | 2.0% |
| 1953 | 5.7% | 1974 | 2.7% | 1995 | 2.1% |
| 1954 | 5.6% | 1975 | 2.6% | 1996 | 2.2% |
| 1955 | 4.5% | 1976 | 2.4% | 1997 | 2.2% |
| 1956 | 4.9% | 1977 | 2.8% | 1998 | 2.2% |
| 1957 | 4.7% | 1978 | 2.7% | 1999 | 2.0% |
| 1958 | 4.4% | 1979 | 2.6% | 2000 | 2.1% |
| 1959 | 3.5% | 1980 | 2.4% | 2001 | 1.7% |
| 1960 | 4.1% | 1981 | 2.0% | 2002e | 1.3% |
| 1961 | 3.9% | 1982 | 1.5% | 2003e | 1.4% |
| 1962 | 3.6% | 1983 | 1.1% | ||
| Corporate income taxes, $-billions and as shares of GDP (fiscal years) | |||||
| 2001 | 2002e | 2003e | 2004e | 02-04e | |
| Corporate income taxes before “stimulus” | $ 151.1 | $ 197.0 | $ 187.0 | $ 202.0 | $ 586.0 |
| Add back (+) or subtract (–) artificial shifts in corporate tax payments in 2001 tax cut act* | +23.0 | –23.0 | — | +6.6 | –16.4 |
| Revised corporate taxes before “stimulus” | 174.1 | 174.0 | 187.0 | 208.6 | 569.6 |
| “Stimulus” corporate tax cuts** | — | –37.7 | –35.8 | –22.7 | –96.1 |
| Revised corporate taxes after “stimulus” | $ 174.1 | $ 136.3 | $ 151.2 | $ 185.9 | $ 473.5 |
| Corporate taxes as a % of GDP | 1.7% | 1.3% | 1.4% | 1.6% | 1.4% |
| *Takes out the effects of the two-week delay in the Sept. 2001 corporate estimated tax payment date (which shifted $23 billlion from fiscal 2001 to fiscal 2002) and a smaller shift in fiscal 2004 (from fiscal 2005). **Excludes estimated portion of $114 billion in 2002-04 “stimulus” business tax cuts going to non-corporations. Sources: Congressional Budget Office, Joint Committee on Taxation, Citizens for Tax Justice, 2002. |
|||||


